My Chart Control
- Utilitaires
- Version: 1.8
- Mise à jour: 29 septembre 2026

Important:
Do not download or install My Chart Control unless you already own My Chart Generator service. My Chart Control is not a standalone chart generator. It is designed to work together with the custom charts produced by My Chart Generator.
Your Range/Volume chart, optimized for your indicator — automatically.
My Chart Control is the on-chart dashboard and intelligence interface for My Chart Generator. Attach it to your My Chart custom symbol chart and it gives you complete control over bar construction, automatic R/V calibration, indicator profile scoring, market regime detection, and consolidation zone analysis — all from a single, clean panel without touching any input dialog.
THE PROBLEM IT SOLVES
Instead of trying to find the best indicator that fits your timeframe chart, build a chart and find the most appropriate indicator. Range/Volume charting is powerful, but choosing the right Range and Volume thresholds has always been guesswork. Too tight and every tick closes a bar. Too wide and you miss intraday structure. And even when you find a balanced chart, there is no guarantee it is optimised for the specific indicator you trade. My Chart Control eliminates that guesswork entirely. It pRovides three diffeent types of charts: RVH BALANCED CHART, RVH BALANCED CHART, CONSTANT VOLUME CHART.
IMPORTANT NOTE: HISTORY OF AVAILABLE TICK DATA DEPENDS ON YOUR BROKER
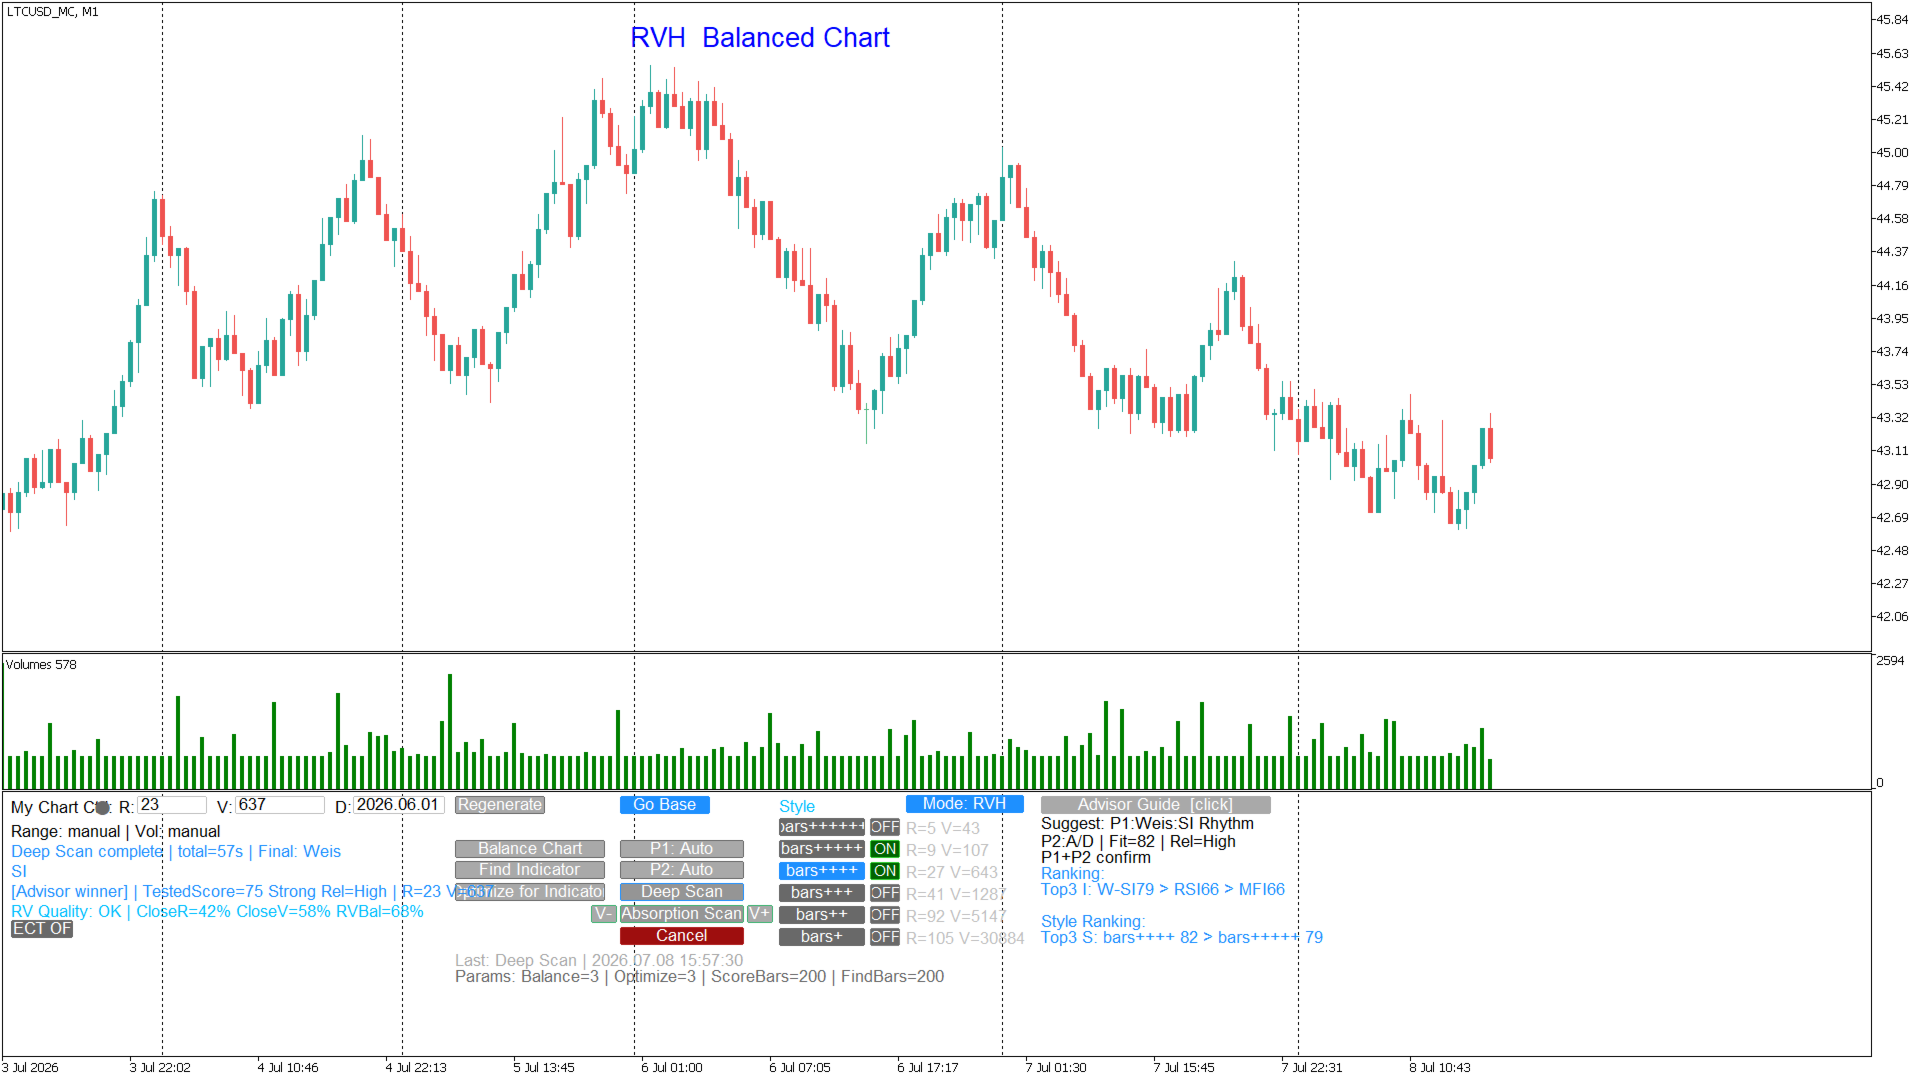
RVH BALANCE CHART — ONE CLICK R/V CALIBRATION
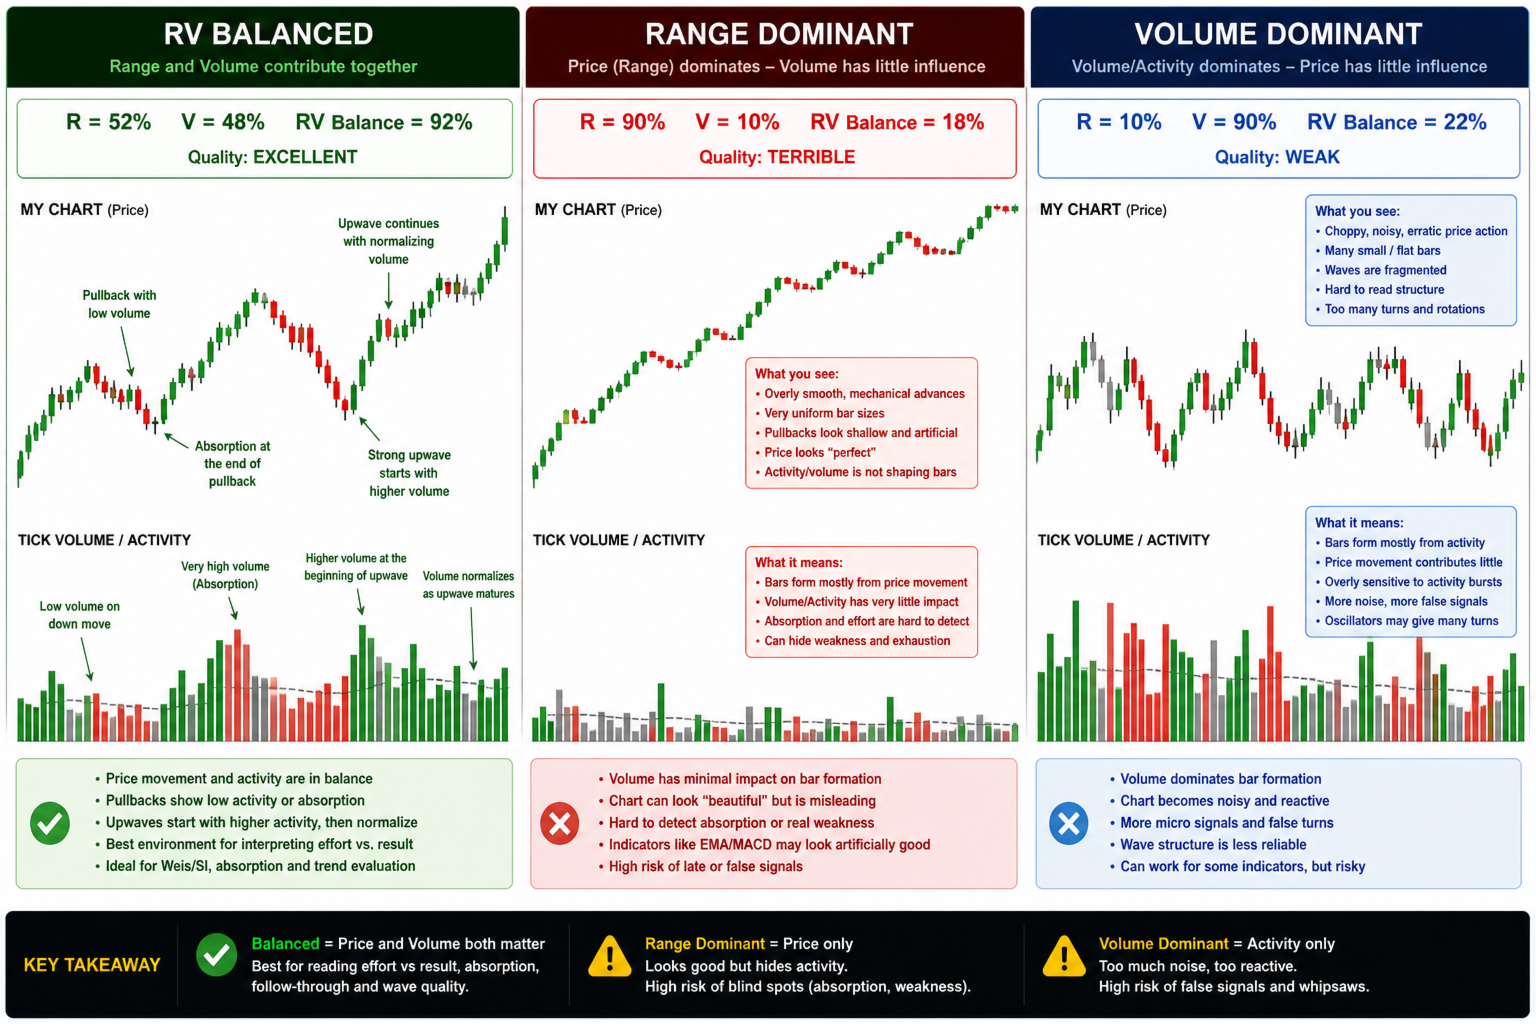
The Balance Chart function analyses the bottleneck split of the current custom chart: what percentage of bars closed because the Range threshold was satisfied first (R%), the Volume threshold first (V%), or both simultaneously (S%). It then automatically adjusts Range and Volume across multiple passes until both dimensions contribute roughly equally — producing a chart where price movement and volume carry balanced weight in every bar. A balanced chart has a cleaner, more consistent rhythm and responds more reliably to indicator signals.
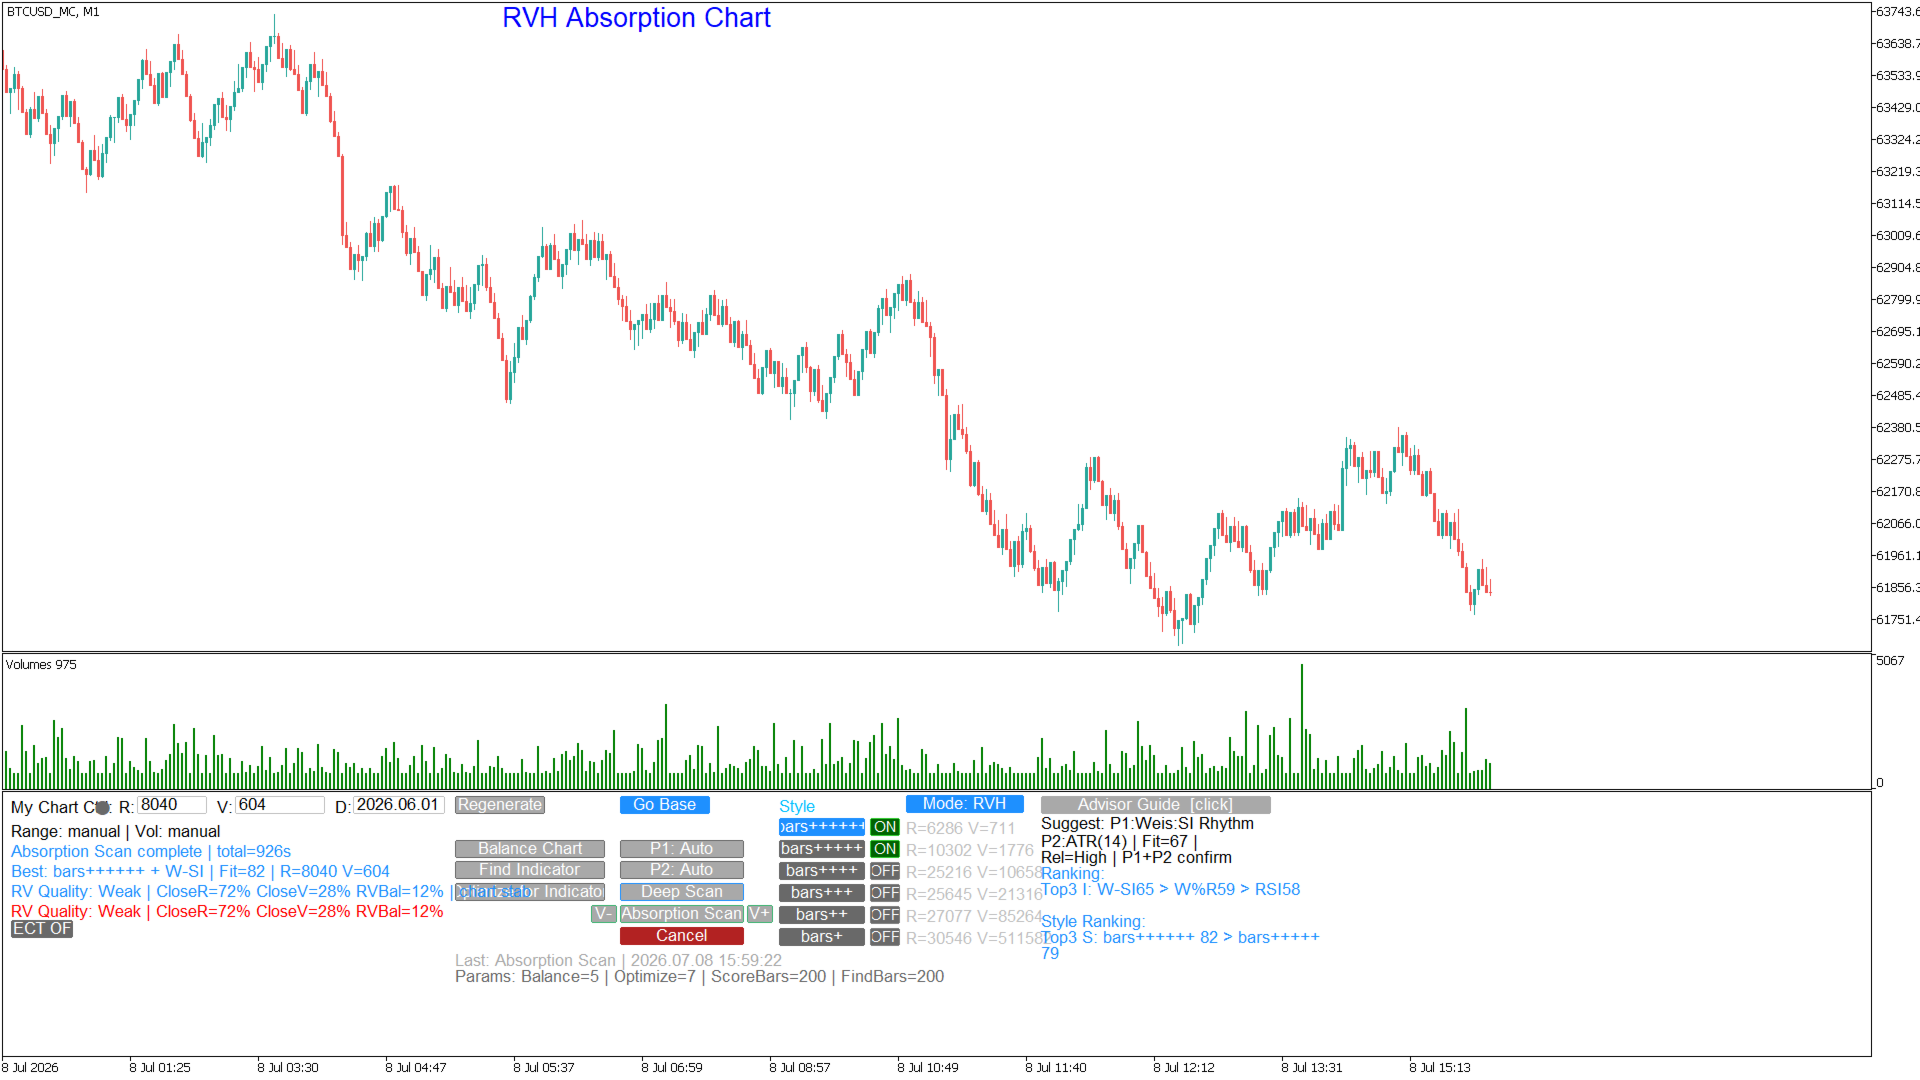
RVH ABSORPTION CHART — ONE CLICK R/V ABSORPTION CALIBRATION
The Absorption Chart function creates a chart that focuses on areas that volume absorption occurs.
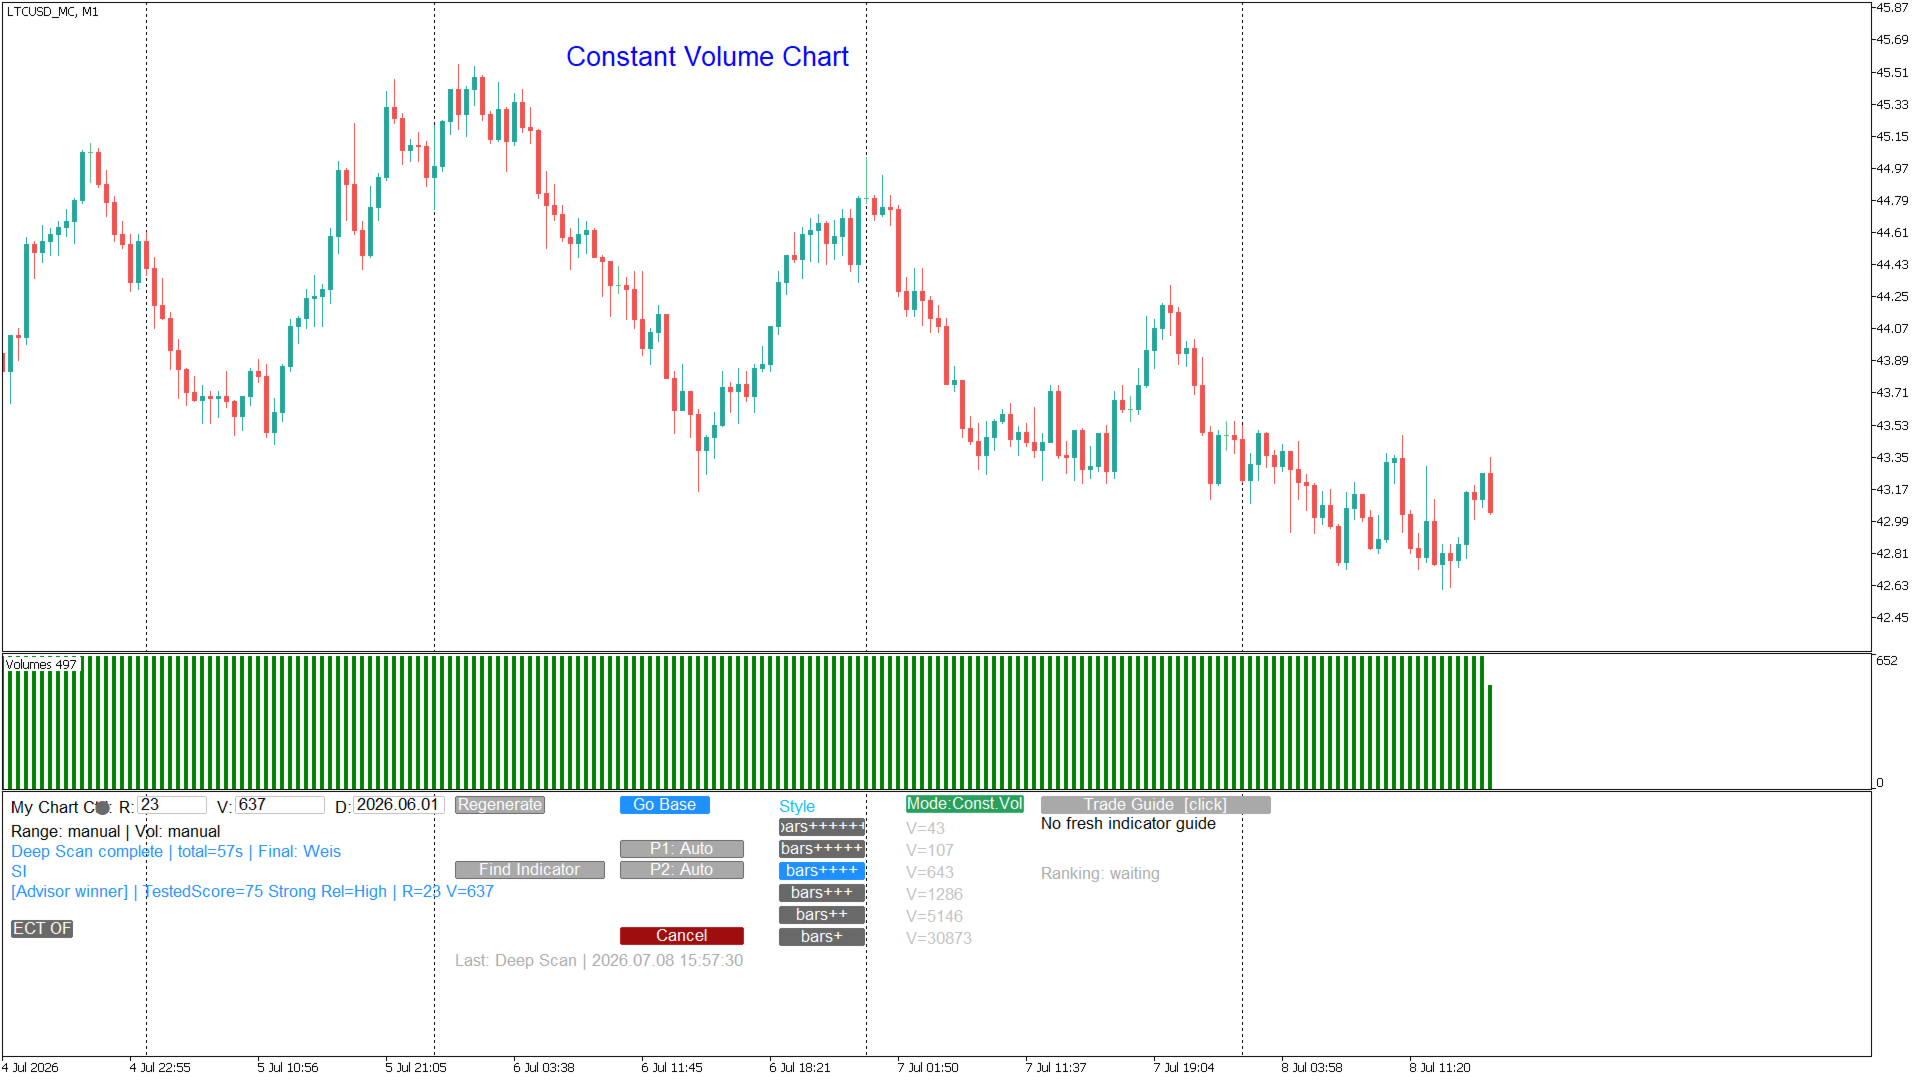
CONSTANT VOLUME CHART — ONE CLICK CREATION
The Constant Volume Chart function creates a chart to equal volume per bar that can be adjusted according to your preference.
FIND INDICATOR — MARKET REGIME DETECTION
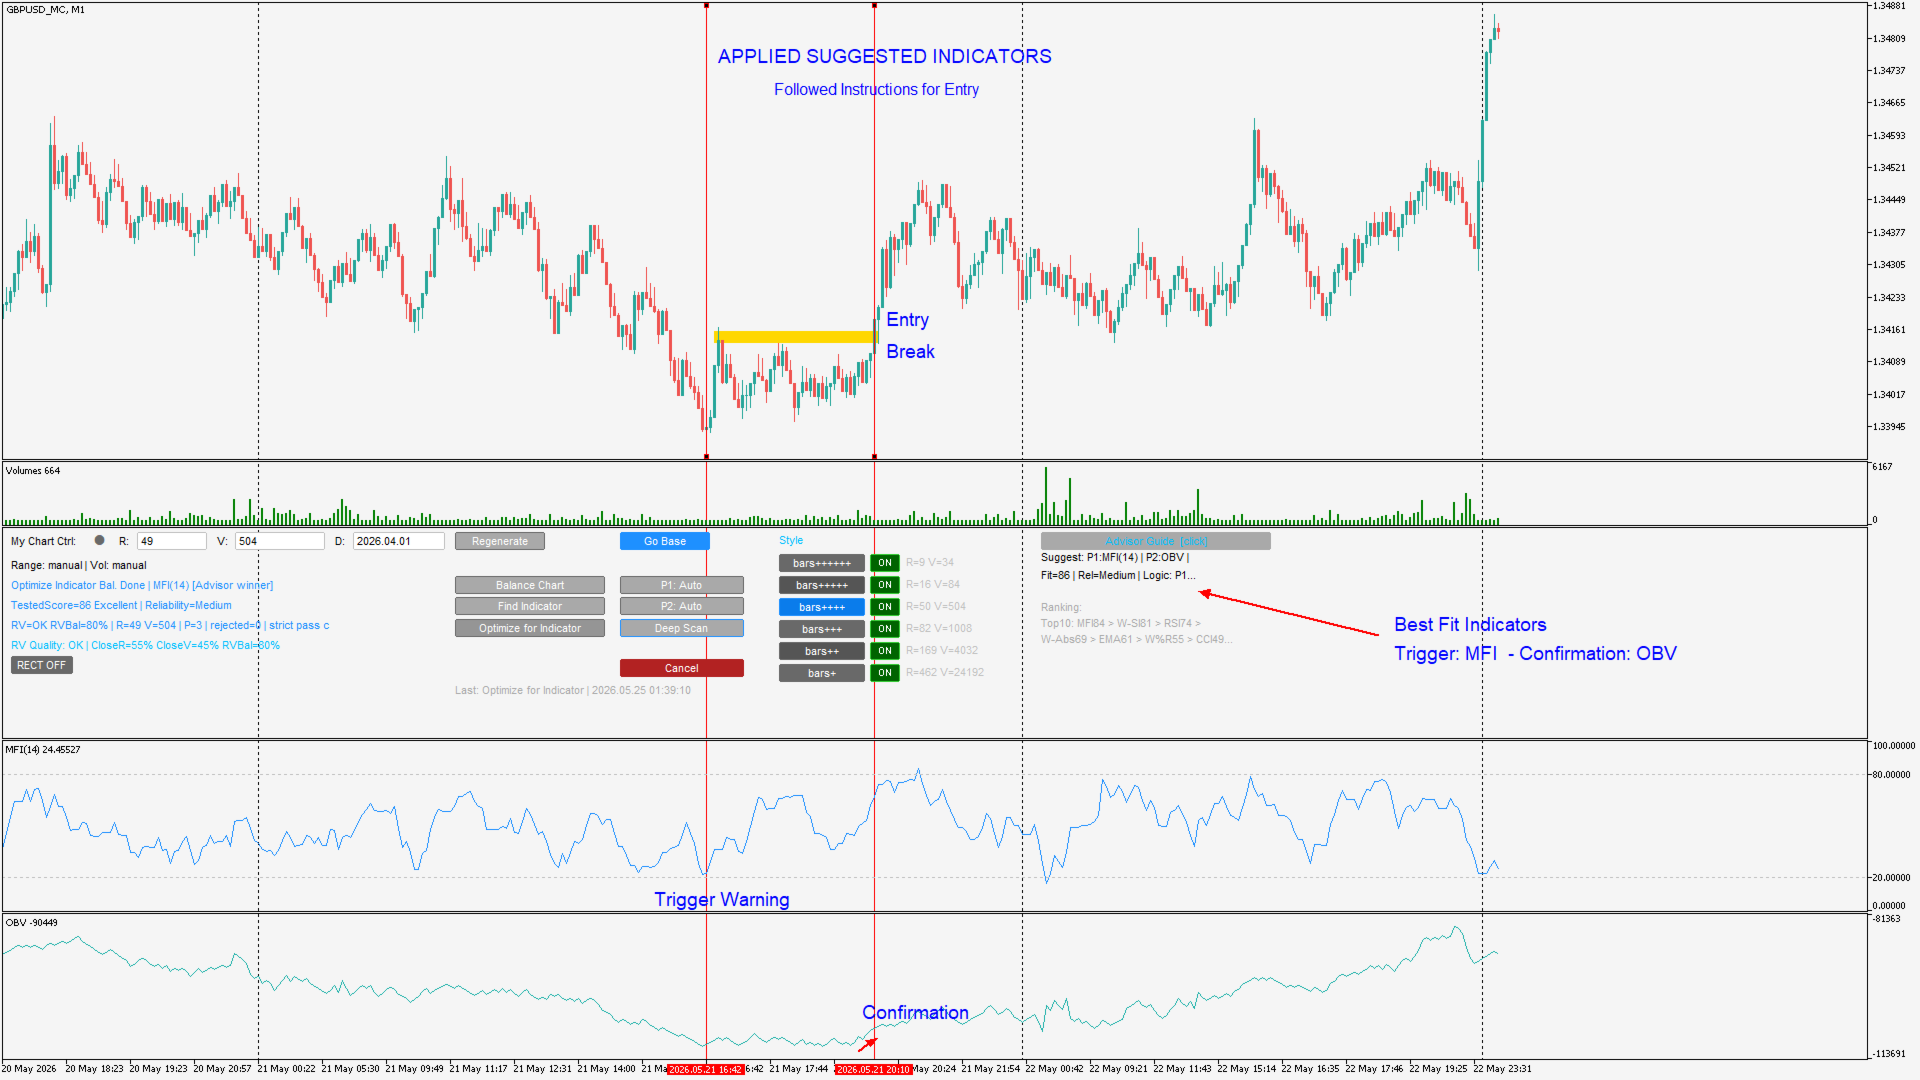
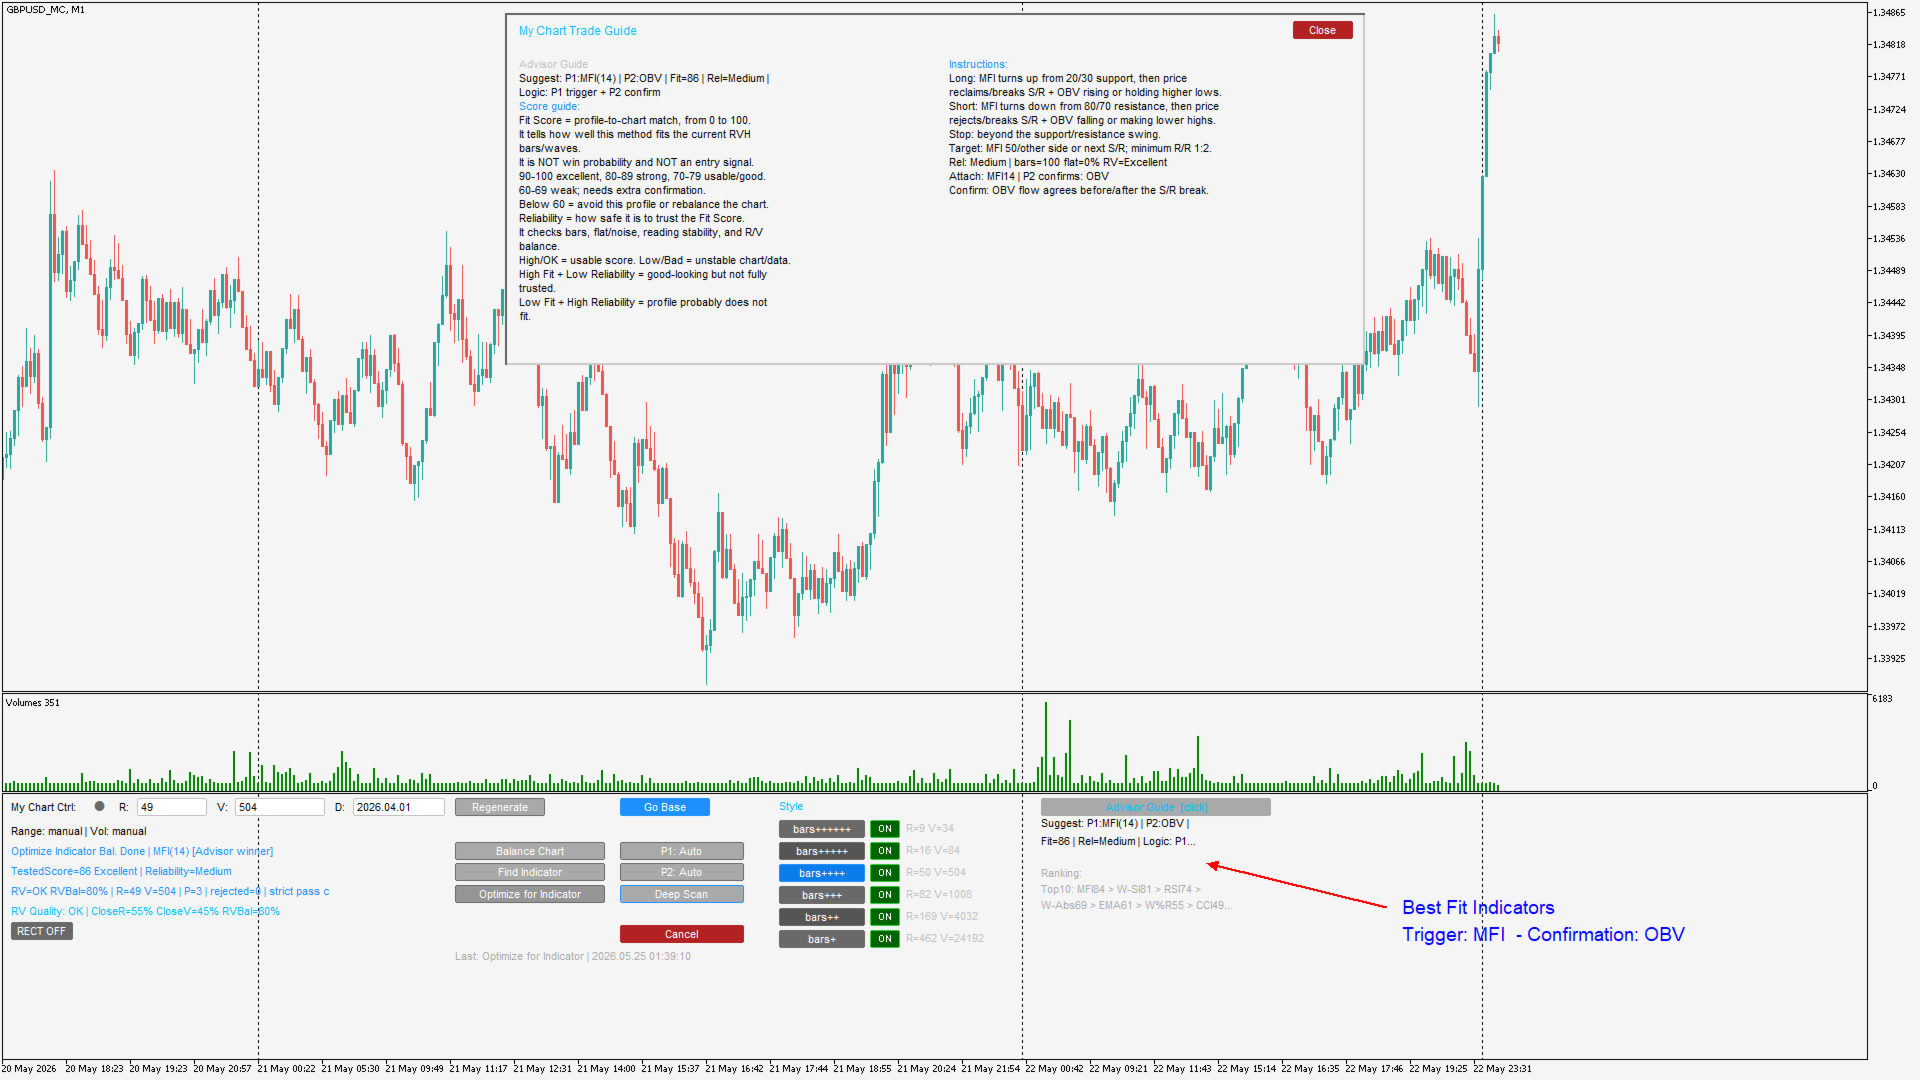
The Find Indicator button triggers the Generator's built-in Advisor, which analyses the most recent bars of your custom chart and detects the dominant market behaviour pattern: trend impulse, trend pullback, range rotation, breakout expansion, compression, absorption, or chop. Based on the detected regime it recommends the primary indicator profile and optional confirmation filter best suited to current conditions, along with a full trading guide covering entry logic, stop placement, and target approach. The result is displayed in the Trade Guide panel on the right side of the screen.
OPTIMIZE FOR INDICATOR — AUTOMATED MULTI-PASS R/V SEARCH
This is the core function that makes My Chart Control unique. When you click Optimize for Indicator, the system runs a configurable number of passes — each one testing a different R/V combination, sending it to the Generator, waiting for the chart to rebuild, scoring the selected indicator profile's signal quality, and comparing the result against all previous candidates. When all passes complete the best-scoring R/V combination with a good balance grade is applied automatically. No manual testing, no spreadsheet of results to compare — the system finds the optimal settings for your indicator on your symbol.
If Profile 1 is set to Auto, Optimize for Indicator runs Find Indicator automatically before the first pass and uses the Advisor's winner as the scoring profile. The entire workflow — regime detection, indicator recommendation, and multi-pass R/V optimisation — executes in a single click.
DEEP SCAN — FULL AUTOMATIC STYLE SEARCH
Deep Scan is the most comprehensive calibration tool in the system. With one click it cycles through all six style presets (bars+ through bars++++++), runs Balance Chart and Find Indicator for each style, scores the best indicator profile at each rhythm, and at the end applies the style, R/V, and profile combination that produced the highest overall score. Use it when you are starting fresh on a new symbol or after a significant market regime change to find the optimal starting configuration from scratch.
SUPPORTED INDICATOR PROFILES
My Chart Control supports 15 built-in indicator profiles plus External Indicator for any custom MQL5 indicator:
Primary profiles (P1): Auto, RSI, MACD, Stochastic, MFI, Williams %R, CCI, EMA/MA, EMA Cross, Bollinger Bands, Weis/Speed Index, Weis Follow, Wave Absorption, Flat Absorption, External Indicator.
Confirmation filters (P2): Auto, None, ADX, MFI, OBV, ATR, Accumulation/Distribution.
CONSOLIDATION ZONES AND BREAKOUT ALERTS
My Chart Control automatically detects consolidation zones — areas where price has closed inside a reference bar's range for a configurable number of consecutive bars — and draws them as rectangles directly on the custom chart. When price breaks out of a confirmed consolidation zone an alert fires via MT5 pop-up, email, or mobile push notification. The RECT button toggles rectangle visibility without losing the detection state.
STYLE BUTTONS WITH LIVE R/V PREVIEW
Six style preset buttons (bars+ through bars++++++) let you switch bar rhythm in one click. Beside each button the panel displays the Generator's recommended R/V for that style based on the symbol's recent tick activity, so you can compare all six options before committing.
REQUIREMENTS
— MetaTrader 5 terminal, build 3000 or later.
— My Chart Generator service (sold separately ). https://www.mql5.com/en/market/product/178752
— Both components must use the same Output Suffix setting.
To download the manual sign up for free on my site: www.tradethevolumewaves.com and download it from your profile menu under files