MPA Trend Dashboard MT4
- Indicateurs
-
Andrei Strashko
 Je m’appelle Andrey. Je suis trader professionnel et développeur de solutions de trading pour MetaTrader 4 et MetaTrader 5. Depuis plus de 10 ans, je crée des robots de trading, des indicateurs, des scripts et des stratégies, en combinant une expérience réelle du marché avec une solide maîtrise de
 - Version: 1.4
- Activations: 10
MPA Trend Dashboard — Multi-Symbol Market Scanner for MetaTrader 4
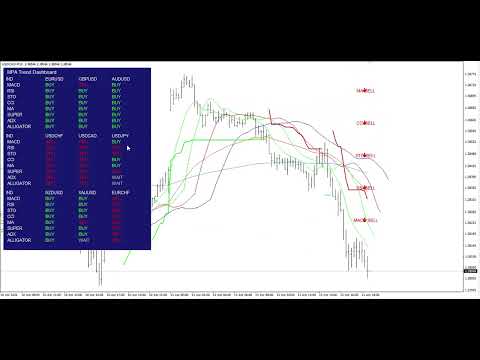
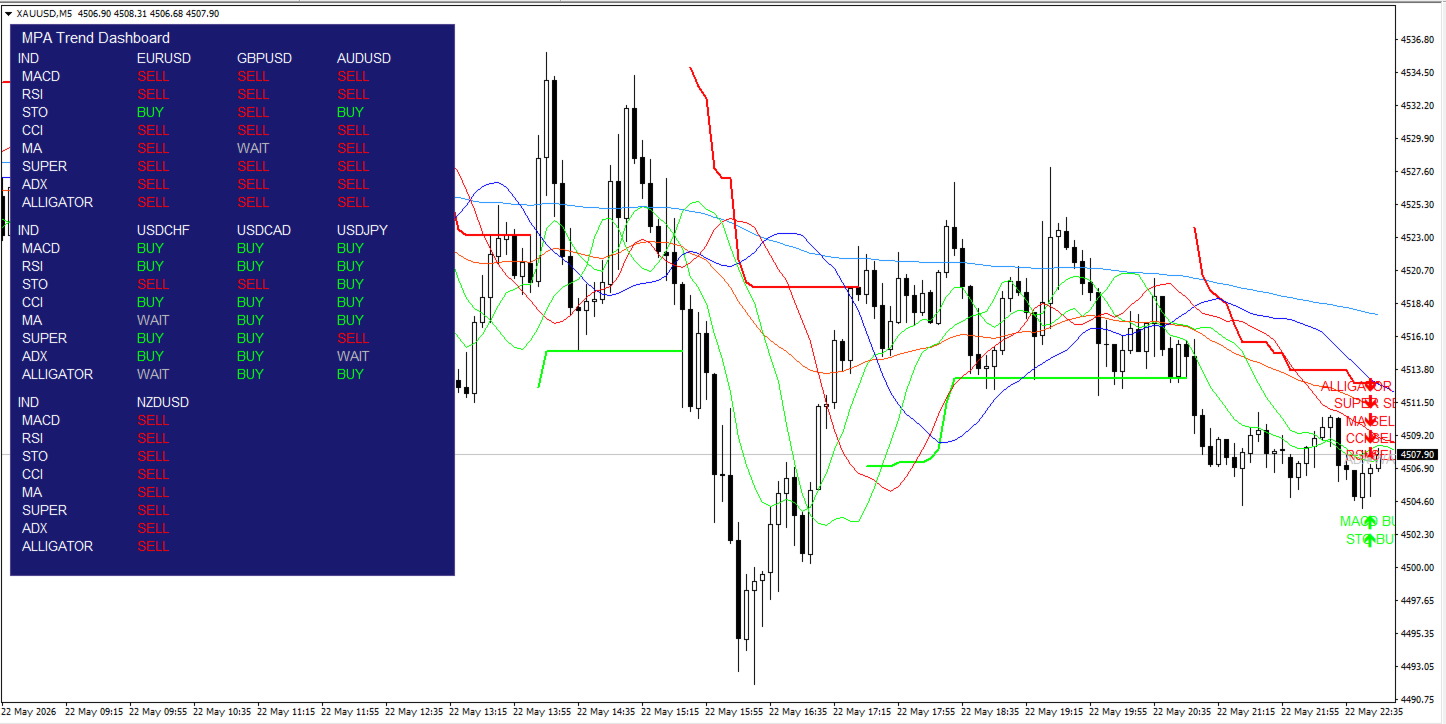
MPA Trend Dashboard is a multi-symbol technical analysis indicator for MetaTrader 4. It is designed to help traders monitor several trading instruments from one chart and quickly evaluate market direction using a combination of popular technical indicators.
The indicator displays a compact signal dashboard directly on the chart. For each selected symbol, it shows BUY, SELL or WAIT signals based on multiple market analysis tools.
User Guide
Main Idea
MPA Trend Dashboard helps traders avoid switching between many charts manually. Instead, it places a market overview table on one chart and shows the current technical condition for each selected symbol.
The indicator analyzes every symbol using the following tools:
MACD
RSI
Stochastic
CCI
EMA Trend
SuperTrend
ADX
Bill Williams Alligator
Each indicator produces a simple signal:
BUY — bullish condition
SELL — bearish condition
WAIT — neutral condition, weak confirmation or insufficient data
This makes it easier to find symbols where several indicators point in the same direction.
Key Features
Multi-symbol dashboard
The indicator can monitor up to 9 symbols at the same time. The default list includes major Forex pairs, and the user can change all symbols in the settings.
Signal table directly on the chart
All signals are displayed in a clear chart panel. The dashboard shows each symbol and the signal status for every included indicator.
Multiple technical indicators
MPA Trend Dashboard combines trend indicators, momentum indicators and oscillators to give a broader view of market conditions.
BUY / SELL / WAIT logic
Signals are simplified into three clear states, making the dashboard easy to read during live market monitoring.
Current chart visualization
The indicator can display visual elements on the current chart, including EMA lines, SuperTrend, Alligator lines and signal labels.
Broker suffix support
The indicator can detect broker-specific symbol suffixes such as EURUSDm, EURUSD.pro and similar formats.
Automatic object cleanup
When the indicator is removed from the chart, all dashboard objects and signal labels are deleted automatically.
Strategy Tester safe mode
The MT4 Strategy Tester has limitations with multi-symbol data. The indicator includes a tester-safe mode that can display only the current chart symbol during testing to avoid frozen WAIT columns caused by unavailable cross-symbol history.
Included Signal Modules
MACD
MACD is used to evaluate momentum direction. When the MACD main line is above the signal line, the module returns BUY. When the main line is below the signal line, it returns SELL.
RSI
RSI is used to evaluate relative market strength. If RSI is above the selected buy level, the signal is BUY. If RSI is below the selected sell level, the signal is SELL.
Stochastic
Stochastic compares the %K and %D lines. If %K is above %D, the signal is BUY. If %K is below %D, the signal is SELL.
CCI
CCI measures deviation from the average price. Values above zero return BUY. Values below zero return SELL.
EMA Trend
The EMA module uses three exponential moving averages. If the fast EMA is above the medium EMA and the medium EMA is above the slow EMA, the signal is BUY. If the fast EMA is below the medium EMA and the medium EMA is below the slow EMA, the signal is SELL.
SuperTrend
SuperTrend uses ATR and a multiplier to define the active trend direction. An upward SuperTrend state returns BUY. A downward SuperTrend state returns SELL.
ADX
ADX is used to confirm trend strength. If ADX is below the selected minimum level, the module returns WAIT. If ADX is strong enough and +DI is above -DI, the signal is BUY. If -DI is above +DI, the signal is SELL.
Bill Williams Alligator
The Alligator module uses Jaw, Teeth and Lips lines. If the lines are arranged in bullish order and price is above the Lips line, the signal is BUY. If the lines are arranged in bearish order and price is below the Lips line, the signal is SELL.
Chart Visualization
MPA Trend Dashboard can display additional visual elements on the current chart:
EMA Fast
EMA Medium
EMA Slow
SuperTrend Up / Down line
Alligator Jaw
Alligator Teeth
Alligator Lips
BUY / SELL / WAIT signal labels
The visualization is intended for the current chart symbol. The dashboard itself can still monitor multiple symbols, depending on data availability.
Main Inputs
symbolName1–symbolName9
Symbols to monitor in the dashboard.
WorkTimeframe
The timeframe used for calculations. If PERIOD_CURRENT is selected, the indicator uses the current chart timeframe.
UseClosedBar
If enabled, signals are calculated using the last closed candle. This reduces signal changes during the currently forming candle.
updateSeconds
Timer update interval.
EMA1_period
Fast EMA period.
EMA2_period
Medium EMA period.
EMA3_period
Slow EMA period.
MACD_fast_period
Fast MACD period.
MACD_slow_period
Slow MACD period.
MACD_signal_period
MACD signal period.
RSI_period
RSI calculation period.
RSI_buy_level
RSI level used for bullish confirmation.
RSI_sell_level
RSI level used for bearish confirmation.
Stochastic_period
Main Stochastic period.
Stochastic_D
Stochastic signal period.
Stochastic_slowing
Stochastic slowing parameter.
CCI_period
CCI calculation period.
SuperTrend_ATR_Period
ATR period used by SuperTrend.
SuperTrend_Multiplier
ATR multiplier used by SuperTrend.
SuperTrend_Bars
Number of bars used for SuperTrend calculations.
ADX_period
ADX calculation period.
ADX_min_level
Minimum ADX value required for a valid directional signal.
Alligator_Jaw_Period
Jaw period.
Alligator_Jaw_Shift
Jaw shift.
Alligator_Teeth_Period
Teeth period.
Alligator_Teeth_Shift
Teeth shift.
Alligator_Lips_Period
Lips period.
Alligator_Lips_Shift
Lips shift.
ShowDashboard
Shows or hides the dashboard table.
VisualizeAllIndicators
Enables or disables chart visualization.
ShowEMAOnChart
Shows or hides EMA lines.
ShowSuperTrendOnChart
Shows or hides SuperTrend.
ShowAlligatorOnChart
Shows or hides Alligator lines.
ShowSignalMarkersOnChart
Shows or hides signal labels on the current chart.
FastTestingMode
Optimization mode for the MT4 Strategy Tester.
TesterUseCurrentSymbolOnly
When enabled in the Strategy Tester, the dashboard uses only the current chart symbol. This avoids unavailable multi-symbol data issues in MT4 testing.
HideNoDataSymbols
Hides symbols that do not have usable data.
Recommended Use
MPA Trend Dashboard is best used as a market scanning and confirmation tool. It helps identify symbols where several indicators support the same direction.
For more stable signals, UseClosedBar is recommended. This makes the indicator calculate signals from the last completed candle instead of the current live candle.
The indicator can be used on different timeframes:
M5 and M15 for short-term monitoring
M30 and H1 for intraday trading
H4 and D1 for higher-timeframe trend analysis
Notes About MT4 Strategy Tester
MetaTrader 4 has limited support for multi-symbol data in the Strategy Tester. Because of this, some symbols may not have available historical data during testing. The indicator includes TesterUseCurrentSymbolOnly mode to prevent inactive dashboard columns.
For real-time trading and live chart monitoring, multi-symbol analysis works when the required symbols are available in Market Watch and historical data is loaded.
Advantages
One chart for monitoring multiple symbols
Simple BUY / SELL / WAIT signals
Uses several popular technical indicators
Visual trend tools on the current chart
Supports broker symbol suffixes
Customizable indicator parameters
Customizable dashboard appearance
Automatic cleanup after removing the indicator
Tester-safe mode for MT4 limitations
Important Notice
MPA Trend Dashboard is an analytical indicator. It does not open, close or manage trades automatically. It is not an Expert Advisor.
The indicator is designed to support manual decision-making by showing technical signals in a structured dashboard. It does not guarantee profit and cannot remove trading risk. Traders should test the indicator on a demo account and use proper risk management before trading on a live account.