MPA Trend Dashboard MT4

MPA Trend Dashboard — Multi-Symbol Market Scanner for MetaTrader 4

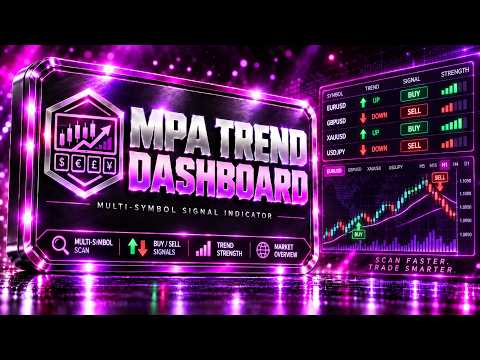
MPA Trend Dashboard is a multi-symbol technical analysis indicator for MetaTrader 4. It is designed to help traders monitor several trading instruments from one chart and quickly evaluate market direction using a combination of popular technical indicators.

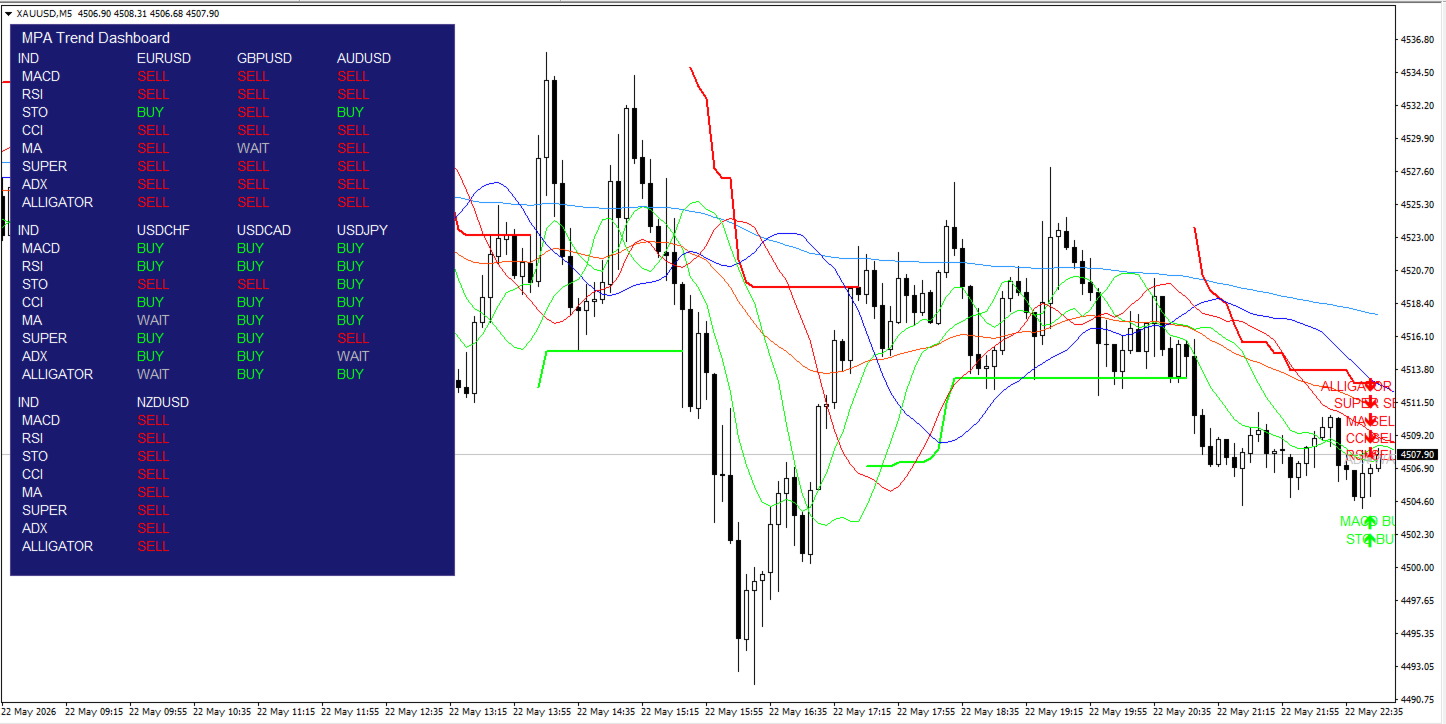
The indicator displays a compact signal dashboard directly on the chart. For each selected symbol, it shows BUY, SELL or WAIT signals based on multiple market analysis tools.

User Guide 

Main Idea

MPA Trend Dashboard helps traders avoid switching between many charts manually. Instead, it places a market overview table on one chart and shows the current technical condition for each selected symbol.

The indicator analyzes every symbol using the following tools:

MACD
RSI
Stochastic
CCI
EMA Trend
SuperTrend
ADX
Bill Williams Alligator

Each indicator produces a simple signal:

BUY — bullish condition
SELL — bearish condition
WAIT — neutral condition, weak confirmation or insufficient data

This makes it easier to find symbols where several indicators point in the same direction.

Key Features

Multi-symbol dashboard
The indicator can monitor up to 9 symbols at the same time. The default list includes major Forex pairs, and the user can change all symbols in the settings.

Signal table directly on the chart
All signals are displayed in a clear chart panel. The dashboard shows each symbol and the signal status for every included indicator.

Multiple technical indicators
MPA Trend Dashboard combines trend indicators, momentum indicators and oscillators to give a broader view of market conditions.

BUY / SELL / WAIT logic
Signals are simplified into three clear states, making the dashboard easy to read during live market monitoring.

Current chart visualization
The indicator can display visual elements on the current chart, including EMA lines, SuperTrend, Alligator lines and signal labels.

Broker suffix support
The indicator can detect broker-specific symbol suffixes such as EURUSDm, EURUSD.pro and similar formats.

Automatic object cleanup
When the indicator is removed from the chart, all dashboard objects and signal labels are deleted automatically.

Strategy Tester safe mode
The MT4 Strategy Tester has limitations with multi-symbol data. The indicator includes a tester-safe mode that can display only the current chart symbol during testing to avoid frozen WAIT columns caused by unavailable cross-symbol history.

Included Signal Modules

MACD
MACD is used to evaluate momentum direction. When the MACD main line is above the signal line, the module returns BUY. When the main line is below the signal line, it returns SELL.

RSI
RSI is used to evaluate relative market strength. If RSI is above the selected buy level, the signal is BUY. If RSI is below the selected sell level, the signal is SELL.

Stochastic
Stochastic compares the %K and %D lines. If %K is above %D, the signal is BUY. If %K is below %D, the signal is SELL.

CCI
CCI measures deviation from the average price. Values above zero return BUY. Values below zero return SELL.

EMA Trend
The EMA module uses three exponential moving averages. If the fast EMA is above the medium EMA and the medium EMA is above the slow EMA, the signal is BUY. If the fast EMA is below the medium EMA and the medium EMA is below the slow EMA, the signal is SELL.

SuperTrend
SuperTrend uses ATR and a multiplier to define the active trend direction. An upward SuperTrend state returns BUY. A downward SuperTrend state returns SELL.

ADX
ADX is used to confirm trend strength. If ADX is below the selected minimum level, the module returns WAIT. If ADX is strong enough and +DI is above -DI, the signal is BUY. If -DI is above +DI, the signal is SELL.

Bill Williams Alligator
The Alligator module uses Jaw, Teeth and Lips lines. If the lines are arranged in bullish order and price is above the Lips line, the signal is BUY. If the lines are arranged in bearish order and price is below the Lips line, the signal is SELL.

Chart Visualization

MPA Trend Dashboard can display additional visual elements on the current chart:

EMA Fast
EMA Medium
EMA Slow
SuperTrend Up / Down line
Alligator Jaw
Alligator Teeth
Alligator Lips
BUY / SELL / WAIT signal labels

The visualization is intended for the current chart symbol. The dashboard itself can still monitor multiple symbols, depending on data availability.

Main Inputs

symbolName1–symbolName9
Symbols to monitor in the dashboard.

WorkTimeframe
The timeframe used for calculations. If PERIOD_CURRENT is selected, the indicator uses the current chart timeframe.

UseClosedBar
If enabled, signals are calculated using the last closed candle. This reduces signal changes during the currently forming candle.

updateSeconds
Timer update interval.

EMA1_period
Fast EMA period.

EMA2_period
Medium EMA period.

EMA3_period
Slow EMA period.

MACD_fast_period
Fast MACD period.

MACD_slow_period
Slow MACD period.

MACD_signal_period
MACD signal period.

RSI_period
RSI calculation period.

RSI_buy_level
RSI level used for bullish confirmation.

RSI_sell_level
RSI level used for bearish confirmation.

Stochastic_period
Main Stochastic period.

Stochastic_D
Stochastic signal period.

Stochastic_slowing
Stochastic slowing parameter.

CCI_period
CCI calculation period.

SuperTrend_ATR_Period
ATR period used by SuperTrend.

SuperTrend_Multiplier
ATR multiplier used by SuperTrend.

SuperTrend_Bars
Number of bars used for SuperTrend calculations.

ADX_period
ADX calculation period.

ADX_min_level
Minimum ADX value required for a valid directional signal.

Alligator_Jaw_Period
Jaw period.

Alligator_Jaw_Shift
Jaw shift.

Alligator_Teeth_Period
Teeth period.

Alligator_Teeth_Shift
Teeth shift.

Alligator_Lips_Period
Lips period.

Alligator_Lips_Shift
Lips shift.

ShowDashboard
Shows or hides the dashboard table.

VisualizeAllIndicators
Enables or disables chart visualization.

ShowEMAOnChart
Shows or hides EMA lines.

ShowSuperTrendOnChart
Shows or hides SuperTrend.

ShowAlligatorOnChart
Shows or hides Alligator lines.

ShowSignalMarkersOnChart
Shows or hides signal labels on the current chart.

FastTestingMode
Optimization mode for the MT4 Strategy Tester.

TesterUseCurrentSymbolOnly
When enabled in the Strategy Tester, the dashboard uses only the current chart symbol. This avoids unavailable multi-symbol data issues in MT4 testing.

HideNoDataSymbols
Hides symbols that do not have usable data.

Recommended Use

MPA Trend Dashboard is best used as a market scanning and confirmation tool. It helps identify symbols where several indicators support the same direction.

For more stable signals, UseClosedBar is recommended. This makes the indicator calculate signals from the last completed candle instead of the current live candle.

The indicator can be used on different timeframes:

M5 and M15 for short-term monitoring
M30 and H1 for intraday trading
H4 and D1 for higher-timeframe trend analysis

Notes About MT4 Strategy Tester

MetaTrader 4 has limited support for multi-symbol data in the Strategy Tester. Because of this, some symbols may not have available historical data during testing. The indicator includes TesterUseCurrentSymbolOnly mode to prevent inactive dashboard columns.

For real-time trading and live chart monitoring, multi-symbol analysis works when the required symbols are available in Market Watch and historical data is loaded.

Advantages

One chart for monitoring multiple symbols
Simple BUY / SELL / WAIT signals
Uses several popular technical indicators
Visual trend tools on the current chart
Supports broker symbol suffixes
Customizable indicator parameters
Customizable dashboard appearance
Automatic cleanup after removing the indicator
Tester-safe mode for MT4 limitations

Important Notice

MPA Trend Dashboard is an analytical indicator. It does not open, close or manage trades automatically. It is not an Expert Advisor.

The indicator is designed to support manual decision-making by showing technical signals in a structured dashboard. It does not guarantee profit and cannot remove trading risk. Traders should test the indicator on a demo account and use proper risk management before trading on a live account.

추천 제품
Pin Bars
Yury Emeliyanov
4.83 (6)
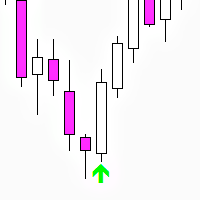
주요 목적:"핀 바"는 금융 시장 차트에서 핀 바를 자동으로 감지하도록 설계되었습니다. 핀 바는 특징적인 몸체와 긴 꼬리를 가진 촛불로,추세 반전 또는 교정을 신호 할 수 있습니다. 작동 원리:표시기는 차트의 각 촛불을 분석하여 촛불의 몸,꼬리 및 코의 크기를 결정합니다. 미리 정의 된 매개 변수에 해당하는 핀 막대가 감지되면 표시기는 핀 막대의 방향(강세 또는 약세)에 따라 위 또는 아래 화살표로 차트에 표시합니다. 매개 변수: 꼬리의 길이와 핀 바의 몸체 크기 사이의 최소 비율을 정의합니다. "코"와 핀 바의 꼬리 사이의 최대 허용 비율을 설정합니다. 화살표 크기-표시된 핀 막대와 차트에서 핀 막대를 가리키는 화살표 사이의 거리를 정의합니다. 신청:"핀 바"표시기는 잠재적 인 추세 반전 지점을 식별하고 시장 또는 가까운 위치에 진입하기 위해 신호를 생성하는 데 사용할 수 있습니다. 올바르게 사용하고 다른 기술 지표 및 분석 방법과 결합하면이 지표는 거래 결과를 향상시킬 수
FREE
PPR and Engulfing
Yury Emeliyanov
5 (3)
PPR 및 Engulfing 은 MetaTrader 4 (MT4) 거래 플랫폼의 통화 차트에서 "PPR" 및 "Engulfing" 패턴을 식별하도록 설계된 독특한 기술 지표입니다. 이러한 패턴은 잠재적인 추세 반전 또는 지속을 나타낼 수 있으며, 트레이더에게 시장 진입 및 퇴출을 위한 귀중한 신호를 제공합니다. 주요 특징: 자동 패턴 감지 : 지표는 PPR 및 Engulfing 패턴을 자동으로 식별하고 차트에 화살표로 표시합니다. 시각적 신호 : 녹색 위쪽 화살표는 매수 지점을 나타내고, 빨간색 아래쪽 화살표는 매도 지점을 나타냅니다. 사용자 정의 가능한 화살표 색상 : 사용자는 지표 설정을 통해 강세 및 약세 신호의 화살표 색상을 선택할 수 있습니다. 모드 선택 : 세 가지 작동 모드 – PPR만, Engulfing만, 또는 두 패턴을 동시에 분석합니다. 사용 방법: 차트에 추가 : 지표를 원하는 통화 쌍 또는 금융 상품의 차트에 적용합니다. 신호 분석 : 차트에서 화살표의 출현을
FREE
Wise Men Indicator demo
Bohdan Kasyanenko
3 (2)
The indicator displays signals according to the strategy of Bill Williams on the chart. Demo version of the indicator has the same features as the paid, except that it can work only on a demo account . Signal "First Wise Man" is formed when there is a divergent bar with angulation.  Bullish divergent bar - with lower minimum and closing price in the upper half. Bearish divergent bar - higher maximum and the closing price at the bottom half. Angulation is formed when all three lines of Alligator
FREE
Trend Mate
ANGEL CALLE CRUZ
1 (1)
TREND MATE is an useful indicator that will support your decision to trade according to the current trend. It is possible to configure alert and push notification to receive when entering to first candle for bull / bear trend. If you want to use this indicator for a EA, use the function iCustom as follows: DOWNTREND : iCustom(NULL,0,"Trend_Mate",0,0) . If downtrend result is "1", otherwise is "0". UPTREND : iCustom(NULL,0,"Trend_Mate",1,0) . If uptrend result is "1", otherwise is "0". For an
FREE
Introduction and Description The indicator displays an arrow whenever a " Bearish Engulfing " is detected. The latter usually indicates the beginning of a downward trend. A bearish engulfing pattern is a technical chart pattern that signals lower prices to come. The pattern consists of an up candlestick followed by a large down candlestick that eclipses or "engulfs" the smaller up candle. The pattern can be important because it shows sellers have overtaken the buyers and are pushing the price mo
FREE
BE auto
Muhammad Ridzuan Mohd Radzali
5 (2)
Indicator automatically draw bullish and bearish engulfing without any rules. Bearish and Bullish engulf is well known area for supply and demand area marking. This indicator can be used in any strategy that required supply demand zone. Show Last Engulf : Enable this option to show unfresh engulfing  Candle to calculate : set 0 will load all history bar and can use up more memory Bearish Engulfing Colour : Pick any colour that suit Bearish Engulfing Colour  : Pick any colour that suit -Use this
FREE
EA Scalping Expert
Gerard Valldosera Gomez
3 (1)
This is a fully automated scalping Expert Advisor that can be run successfully using EURUSD currency pair at H1 timeframe. This EA can't run in the same account. If you want an Expert Advisor that trades daily this is not because it requires patience to wait for a few days or weeks on the right opportunity for it to trade. It takes advantage of the volatility of the price movement.

FREE
UPD1 Rsi Dots Dashboard
Vitaliy Kuznetsov
5 (2)
이 표시기는 차트의 터미널 오실레이터를 기반으로 신호를 표시합니다. 반복되는 신호를 필터링 할 수 있습니다. 여기서 오실레이터는 역 신호를 검색하는 데 사용됩니다. 스윙 전략 및 거래 수준에서 진입 점으로 권장 됩니다. 다중 통화 대시 보드를 사용할 수 있습니다. 그것으로,당신은 쉽게 차트 사이를 전환 할 수 있습니다. 제품 토론에서 대시보드를 포함할 수 있는 알고리즘을 제안할 수 있습니다. 입력 매개변수. 기본 설정. Bars Count – 표시기가 작동하는 히스토리 바의 수. RSI Period – 발진기 기간. RSI Level – 발진기의 레벨. 오실레이터는 0 에서 100 사이입니다. 당신이 10 를 선정하는 경우에,신호는 10 의 위 그리고 90 이하 일 것입니다. RSI Applied Price. Repeat Signal - 반복 신호. Enable – 모든 반복 신호는 화살표/아이콘이 될 것입니다. No Signal – 반복되는 모든 것들은 무시됩니다. 시각
FREE
Three Bar Reversal
Yury Emeliyanov
3 (2)
Three Bar Reversal (MT4) — free indicator Three Bar Reversal is a simple and effective MetaTrader 4 indicator that detects the classic three-bar reversal candlestick pattern with additional filtering based on ATR and candle body sizes. Arrows are displayed on the last closed candle of the pattern, and push notifications are also sent. An automated trading robot Three Bar Reversal EA has been developed based on this indicator. The indicator works on all currency pairs and timeframes but pe
FREE
This indicator plots in the candles the divergence found in the selected indicator and can also send a notification by email and / or to the cell phone. Works on all TIMEFRAMES. Meet Our Products   He identifies the divergences in the indicators: Relative Strength Index (RSI); Moving Average Convergence and Divergence (MACD); Volume Balance (OBV) and;. iStochastic Stochastic Oscillator  (STOCHASTIC). It is possible to choose the amplitude for checking the divergence and the indicator has to b
FREE
The Support & Resistance Breakout Indicator with Smart Alerts a utomatically identifies key support and resistance levels using fractal detection, and receive instant breakout signals enhanced by RSI/CCI confirmation filters. This versatile tool includes   push notifications, email alerts, pop-up alerts, and sound alerts  so you never miss a trading opportunity. Key Features: Dynamic Level Detection  – Draws real-time support and resistance based on market fractals. Breakout Arrows  – Clear vis
FREE
PZ Three Drives
PZ TRADING SLU
5 (2)
This indicator finds Three Drives patterns. The Three Drives pattern is a 6-point reversal pattern characterised by a series of higher highs or lower lows that complete at a 127% or 161.8% Fibonacci extension. It signals that the market is exhausted and a reversal can happen. [ Installation Guide | Update Guide | Troubleshooting | FAQ | All Products  |  Get Help ] Customizable pattern sizes Customizable colors and sizes Customizable breakout periods Customizable 1-2-3 and 0-A-B ratios It impl
FREE
RSI Extreme Zone
Alexander Chertnik
4.4 (5)
The indicator highlights the value in "over Sold" and "over Bought" zones. in addition, arrow indicates the return of the value from the extreme zone. Indicator can be easily customized by the user including change of colors, with, levels and arrows. Combination with other market signals and analysis is necessary and provides more stable results. Alert is also available for user.
FREE
Candle GAP
Thushara Dissanayake
3 (1)
캔들 갭   표시기는 각 요일의 캔들 갭을 자동으로 식별하기 때문에   갭 거래 전략을   활용하는 트레이더에게 필수적인 도구입니다. 갭은 이틀 연속 종가와 시가 사이의 가격 수준 차이를 말합니다. 이 지표는 Common, Breakaway, Continuation 및 Exhaustion의 네 가지 유형의 갭 패턴을 인식합니다. 이 지표를 차트에 통합함으로써 거래자는 신호를 검증하고 거래 결정을 향상시킬 수 있습니다. 캔들 GAP 표시기의 주요 기능 중 하나는 D1(일일) 아래의 모든 기간과 모든 기호 또는 도구에 사용할 수 있는 다용성입니다. 사용하기 쉬운 매개 변수를 제공하여 모든 경험 수준의 트레이더가 액세스할 수 있습니다. 이 지표는 차트에 갭 패턴을 신속하게 그려서 빠른 분석과 의사 결정을 가능하게 합니다. 단순함은 유용성을 더하여 간단하고 효율적인 거래 경험을 보장합니다. 표시기의 데이터 표시 매개변수를 통해 트레이더는 갭 정보의 모양을 사용자 정의할 수 있습니다. 사용자
FREE
Super Auto Fibonacci
Muhammed Emin Ugur
Discover the power of precision and efficiency in your trading with the " Super Auto Fibonacci " MT4 indicator. This cutting-edge tool is meticulously designed to enhance your technical analysis, providing you with invaluable insights to make informed trading decisions. Key Features: Automated Fibonacci Analysis: Say goodbye to the hassle of manual Fibonacci retracement and extension drawing. "Super Auto Fibonacci" instantly identifies and plots Fibonacci levels on your MT4 chart, saving you tim
FREE
QuantumAlert Stoch Navigator is a free indicator available for MT4/MT5 platforms, its work is to provide "alerts" when the market is inside "overbought and oversold" regions in the form of "buy or sell" signals. This indicator comes with many customization options mentioned in the parameter section below, user can customise these parameters as needful. Join our   MQL5 group , where we share important news and updates. You are also welcome to join our private channel as well, contact me for the p
FREE
MQLTA Support Resistance Lines is an indicator that calculates the historical levels of Support and Resistance and display them as Lines on chart. It will also Alert you if the price is in a Safe or Dangerous zone to trade and show you the distance to the next level. The indicator is ideal to be used in other Expert Advisor through the iCustom function. This DEMO only works with AUDNZD, the full product can be found at https://www.mql5.com/en/market/product/26328 How does it work? The indicator
FREE
Support resistanses show
Meysam Ghasemi
1 (1)
.....................................hi....................... ................for showing high s and low s and support and resistanses .....................we have a lot of ways............................... it can be helpful for finding trends , higher highs , higher lows , lower highs , lower lows .......................today i write on of thems.......................... ........................you can enter the number of last support and resistanses .........................and it will dra
FREE
Ppr PA
Yury Emeliyanov
4.75 (4)
"Ppr PA" is a unique technical indicator created to identify "PPR" patterns on the currency charts of the MT4 trading platform. These patterns can indicate possible reversals or continuation of the trend, providing traders with valuable signals to enter the market. Features: Automatic PPR Detection:   The indicator automatically identifies and marks PPR patterns with arrows on the chart. Visual Signals:   Green and red arrows indicate the optimal points for buying and selling, respectively. Ar
FREE
This indicator is a perfect tool able to compare which brokers have the lower latency. It shows us immediately which brokers are slower or faster. When you see the dot icon on the line, it means this broker is the faster one and the red line (Broker_A) is the slower one. See the example on the screenshot. How It Works? This indicator shares the prices information to and from the "shared" common data folder. It compares all the prices. The price is based on average by (Ask + Bid) / 2. There are
FREE
ST Engulfing
Curtis Daniel Jr -
Engulfing candlestick patterns are   comprised of two bars on a price chart. They are used to indicate a market reversal. The second candlestick will be much larger than the first, so that it completely covers or 'engulfs' the length of the previous bar. By combining this with the ability to look at trend direction this indicator eliminates a lot of false signals that are normally generated if no overall trend is taken into consideration
FREE
MACD Intraday Trend MT4
JETINVEST
4.73 (11)
MACD 장중 추세는 1960년대 Gerald Appel이 만든 원본 MACD를 개조하여 개발한 지표입니다. 수년간의 거래를 통해 MACD의 매개변수를 피보나치 비율로 변경함으로써 추세 움직임의 연속성을 더 잘 표현함으로써 가격 추세의 시작과 끝을 보다 효율적으로 감지할 수 있다는 것이 관찰되었습니다. 가격 추세를 감지하는 효율성으로 인해 상단과 하단의 차이를 매우 명확하게 식별하여 거래 기회를 더 잘 활용할 수도 있습니다. 구성 가능한 기능과 경고가 있는 전문가용 버전을 사용해 보십시오:   MACD Intraday Trend PRO 특징 모든 통화 쌍에서 작동 모든 시간대에 작동 Renko 차트와 함께 작동 여전히 질문이 있는 경우 다이렉트 메시지로 저에게 연락하십시오.   https://www.mql5.com/ko/users/robsjunqueira/
FREE
Sentinelle SR
Heritage Finance LTD
Sentinelle SR — structural alerts for the discretionary trader Sentinelle SR is an   alert   indicator, not a robot. It places no orders: it watches market structure and warns you — mobile push, alert window, on-chart panel and CSV log — as soon as a tradable event forms. The final decision stays yours. Designed and field-tested on   XAUUSD M30 . Runs on M15, M30 and H1. What it watches Locked support and resistance on the current and higher timeframe, with a consistency guard (a level can never
FREE
The indicator identifies when a divergence occurs between price and an indicator or oscillator. It identifies bullish and bearish hidden or regular (classical) divergences. Combined with your own rules and techniques, this indicator will allow you to create (or enhance) your own powerful system. For higher probability setups I can recommend you to use my  Supply Demand indicator  and trade only if the divergence occurs inside a zone. Supply zone for bearish div and demand zone for bullish div. T
FREE
Silver Bullet MT4
Saksham Solanki
5 (2)
Contact me for any queries or custom orders, if you want to use this in an EA. Key Features: Pattern Recognition : Identifies Fair Value Gaps (FVGs) Spots Break of Structure (BOS) points Detects Change of Character (CHoCH) patterns Versatile Application : Optimized for candlestick charts Compatible with any chart type and financial instrument Real-Time and Historical Analysis : Works seamlessly with both real-time and historical data Allows for backtesting strategies and live market analysis Vi
FREE
PZ Super Trend
PZ TRADING SLU
4.19 (31)
A top-quality implementation of the famous Super Trend indicator, which needs no introduction. It is completely loyal to the original algorithm, and implements many other useful features such as a multi-timeframe dashboard. [ Installation Guide | Update Guide | Troubleshooting | FAQ | All Products ] Easy to trade It implements alerts of all kinds It implements a multi-timeframe dashboard It is non-repainting and non-backpainting Input Parameters ATR Period - This is the average true range period
FREE
Auto Supply and Demand Oscillator is an indicator for MetaTrader 4 and MetaTrader 5 that detects supply and demand zones automatically and displays them as a single oscillator value at the bottom of the chart, instead of drawing rectangles directly on price. Concept Supply zones are price areas where strong selling created a sharp downward move away from a balance area. Demand zones are price areas where strong buying created a sharp upward move. Traditional implementations draw boxes on the
FREE
Rsi Macd EA
Alexander Chertnik
4.25 (4)
Rsi Macd Expert Advisor uses combined signal from 2 indicators (Rsi / Macd). Minimum trading account 500. best pairs: GBPCAD / EURUSD / CADJPY / USDCHF / GBPUSD / GBPJPY / USDJPY best timeframe: 1H Setting can be define by the user: rsi levels / rsi period / macd period / risk / there are no stop loss or take profit and the expert closes orders by the indicator signal. developed, tested and optimized   on "   VantageMarkets   " platform. Recommended broker > Vantage
FREE
The indicator detects and displays Shark harmonic pattern (see the screenshot). The pattern is plotted by the extreme values of the ZigZag indicator (included in the resources, no need to install). After detecting the pattern, the indicator notifies of that by a pop-up window, a mobile notification and an email. The indicator highlights the process of the pattern formation and not just the complete pattern. In the former case, it is displayed in the contour triangles. After the pattern is comple
TrueChannel
Aleksey Ivanov
5 (8)
The TrueChannel   indicator shows us the true price movement channels. This indicator resembles Donchian Channel   in its appearance, but is built on the basis of completely different principles and gives (in comparison with Donchian Channel , which is better just to use to assess volatility) more adequate trading signals.              As shown in the article , the price actually moves in channels parallel to the time axis and jumps abruptly from the previous channels to the subsequ
FREE
이 제품의 구매자들이 또한 구매함
Trend SniperX MT4
Sarvarbek Abduvoxobov
5 (3)
Trend Sniper X 는 트레이더가 명확하고 정확하게 트렌드 방향과 잠재적 반전 지점을 포착할 수 있도록 돕는 MetaTrader 5 전용 멀티 타임프레임 추세 추종 지표입니다. MT5 버전 링크: https://www.mql5.com/en/market/product/181101 가격 안내: 현재 가격은 프로모션 할인가이며, 향후 업데이트 및 새 기능 출시 시 인상될 수 있습니다. Code2Profit 채널 멀티 타임프레임 분석으로 시장을 정복하세요! Trend Sniper X로 승률을 극대화하는 방법: 핵심 규칙 및 세션 팁 기술 사양 플랫폼 MetaTrader 5 지표 유형 멀티 타임프레임 추세 지표 작동 타임프레임 모든 차트 타임프레임 (상위 타임프레임 M1–MN1 독립 선택 가능) 주요 종목 외환(Forex), 골드(XAUUSD) 및 기타 CFD 추천 계좌 모든 계좌 유형 시각화 컬러 추세 캔들 (매수/매도/약세/변화) + 매수/매도 화살표 추가 모듈 세션 마켓 박스 (
Zoryk Gold mt4
Reda El Koutbane
5 (2)
ZORYK — MetaTrader 4용 XAUUSD 전문 신호 및 트레이드 플래닝 시스템 이런 경험이 있을 것입니다. 골드를 분석하고 진입을 기다린 뒤 마침내 포지션을 열었지만 가격이 곧바로 반대 방향으로 움직입니다. 너무 일찍 청산하거나 Stop Loss를 옮기거나 몇 초 동안 망설입니다. 그 후 시장은 내가 없이도 처음 예상했던 목표까지 정확히 움직입니다. 문제는 항상 방향이 아니었습니다. 진짜 문제는 불확실성이었습니다. 정확한 진입 위치를 몰랐습니다. 어느 지점에서 원래의 트레이드 아이디어가 무효가 되는지 몰랐습니다. 가까운 수익을 확보해야 할지 더 큰 움직임을 기다려야 할지 판단하기 어려웠습니다. 현재 setup이 정말 강한지 아니면 단지 새로운 거래를 억지로 찾고 있는지도 확신하기 어려웠습니다. 골드는 매우 빠르게 움직입니다. 명확한 계획이 없다면 좋은 분석도 몇 초 만에 나쁜 결정으로 바뀔 수 있습니다. ZORYK는 이 문제를 해결하기 위해 개발되었습니다.
SR Liquidity
Oleg Rodin
5 (2)
SR Liquidity 는 시장 유동성이 집중되고 가격이 가장 강력하게 반응하는 숨겨진 구간을 포착하도록 설계된 트레이딩 지표입니다. 이러한 특수 유동성 구간은 강력한 지지 및 저항선 역할을 하며, 시장 반전 가능성이 가장 높은 지점을 명확하게 보여주는 지도가 되어 줍니다. SR Liquidity는 일반적인 지지 및 저항선을 단순히 그리는 대신, 실제 가격 움직임을 분석하여 매수 및 매도 압력이 집중되는 구간을 포착합니다. 이러한 구간은 실질적인 시장의 흐름을 주도하는 유동성 풀(liquidity pools)에 해당합니다. 이 지표는 해당 구간을 차트에 직접 시각화하여, 가격 반응이 실제로 나타나기 전에 이를 미리 예측할 수 있도록 돕습니다. 즉, 가격 추세가 전환될 가능성을 사전에 파악하게 해주는 것입니다. 결과적으로 이 지표는 가공되지 않은 가격 움직임(price action)을 시장의 핵심 가격대, 다시 말해 추세 전환점이 될 수 있는 지점들을 보여주는 명확하고 실용적인 로드맵
Tokyo mt4 Indicator
Vasiliy Strukov
5 (2)
Tokyo Indicator는 추세 방향, 잠재적 거래 신호 및 시장 상황을 명확하고 시각적으로 보여줍니다. 색상으로 구분된 계단식 추세선은 강세 구간(파란색)과 약세 구간(자홍색)을 명확히 구별해 줍니다. 추세가 전환될 때 나타나는 방향성 화살표는 잠재적인 매수 및 매도 기회를 강조하여 보여줍니다. 통합 대시보드는 현재 신호, 시장 성향(bias), 모멘텀, 변동성, 신호 품질 등의 정보를 한눈에 파악할 수 있도록 구성되어 있습니다. 이를 통해 트레이더는 별도의 패널을 오갈 필요 없이 가격 움직임(price action)과 지표의 데이터를 동시에 분석할 수 있습니다. 깔끔한 차트 화면과 간결한 시장 개요를 제공하는 Tokyo Indicator는 체계적인 추세 분석과 거래 결정을 지원합니다. 모든 시간대와 다양한 자산(특히 금)에서 활용할 수 있습니다. 추세 방향, 잠재적 거래 신호 및 시장 상황을 명확하고 시각적으로 보여줍니다. 색상으로 구분된 계단식 추세선은 강세 구간(파란색)
Gann Made Easy
Oleg Rodin
4.84 (172)
Gann Made Easy 는 mr.의 이론을 사용하여 최고의 거래 원칙을 기반으로 하는 전문적이고 사용하기 쉬운 Forex 거래 시스템입니다. W.D. 간. 이 표시기는 Stop Loss 및 Take Profit Levels를 포함하여 정확한 BUY 및 SELL 신호를 제공합니다. PUSH 알림을 사용하여 이동 중에도 거래할 수 있습니다. 구매 후 거래 방법 안내 및 유용한 추가 지표를 무료로 받으시려면 저에게 연락주세요! 아마도 Gann 거래 방법에 대해 이미 여러 번 들었을 것입니다. 일반적으로 Gann의 이론은 초보자 거래자뿐만 아니라 이미 거래 경험이 있는 사람들에게도 매우 복잡한 것입니다. Gann의 거래 방식은 이론적으로 적용하기 쉽지 않기 때문입니다. 나는 그 지식을 연마하고 Forex 지표에 최고의 원칙을 적용하기 위해 몇 년을 보냈습니다. 표시기는 적용하기가 매우 쉽습니다. 차트에 첨부하고 간단한 거래 권장 사항을 따르기만 하면 됩니다. 지표는 지속적으로 시장 분석
Miraculous Indicator Binary & Forex v3 StrategySafe Miraculous Indicator Binary & Forex v3 StrategySafe 는 명확한 신호, 강력한 확인 도구, 그리고 Binary 및 Forex 시장에서 사용할 수 있는 체계적인 거래 방식을 원하는 트레이더를 위한 전문 지표입니다. v3 버전에는 MIR Dashboard, Miraculous Confirmation Dashboard, GANN Law, Square of 9 레벨, GANN 각도, 그리고 더욱 강화된 Forex 모드가 포함되어 있습니다. 주요 기능 Binary 모드와 Forex 모드를 하나의 지표에서 지원. MIR Dashboard로 빠른 시장 흐름 확인. Miraculous Confirmation Dashboard로 진입 신호 확인. Forex 분석을 위한 GANN Law drawing lines. Square of 9 라인, 레벨, 방향 표시. 1x1 G
PTS Precision Index Oscillator V2
PrecisionTradingSystems
5 (1)
프리시전 트레이딩 시스템의 로저 메드칼프에 의한 프리시전 인덱스 오실레이터 (Pi-Osc) 버전 2는 차트에 신속하게 로드되도록 주의 깊게 다시 코딩되었으며 경험을 향상시키기 위해 몇 가지 다른 기술적 개선 사항이 통합되었습니다. Pi-Osc는 정확한 거래 타이밍 신호를 제공하도록 개발되었으며 시장이 모든 사람의 스톱을 청산하기 위해 가야 하는 극도의 고갈 지점을 찾는 데 목적이 있습니다. 이 제품은 극단적인 지점이 어디에 있는지 알고 있는 고전적인 문제를 해결하며 트레이더로서의 삶을 훨씬 간단하게 만듭니다. 이것은 업계 표준 오실레이터와는 상당히 다른 강력한 차이점을 가지고 있는 고도로 복잡한 합의 지표입니다. 사용하는 기능 중 일부는 수요 지수, 자금 흐름, RSI, 스토캐스틱, 패턴 인식, 거래량 분석, 표준 편차 극단점 및 다양한 길이에서 위와 유사한 변형을 갖습니다. 미숙한 눈에는 다른 오실레이터와 비슷해 보일 수 있지만 RSI 또는 모멘텀과 같은 다른 오실레이
Currency Strength Wizard
Oleg Rodin
4.85 (61)
통화 강도 마법사는 성공적인 거래를 위한 올인원 솔루션을 제공하는 매우 강력한 지표입니다. 표시기는 여러 시간 프레임의 모든 통화 데이터를 사용하여 이 또는 해당 외환 쌍의 힘을 계산합니다. 이 데이터는 특정 통화의 힘을 확인하는 데 사용할 수 있는 사용하기 쉬운 통화 지수 및 통화 전력선의 형태로 표시됩니다. 필요한 것은 거래하려는 차트에 표시기를 부착하는 것뿐입니다. 표시기는 거래하는 통화의 실제 강세를 보여줍니다. 지표는 또한 추세와 거래할 때 유리하게 사용할 수 있는 구매 및 판매 거래량 압력의 극한값을 보여줍니다. 지표는 또한 피보나치에 기반한 가능한 대상을 보여줍니다. 표시기는 PUSH 알림을 포함한 모든 유형의 알림을 제공합니다. 구매 후 연락주세요. 나는 당신과 거래 팁을 공유하고 당신에게 무료로 훌륭한 보너스 지표를 줄 것입니다! 나는 당신에게 행복하고 유익한 거래를 기원합니다!
CRT Candle Range Theory HTF MT4 - Ultimate CRT Indicator: 고급 ICT 개념 및 Malaysian SnR 트레이딩 시스템 가장 진보된 Candle Range Theory 지표로 마켓 메이커의 발자취를 마스터하십시오. Ultimate CRT Indicator를 사용하여 Smart Money Concepts(SMC)의 진정한 힘을 발휘하고 기관처럼 정확하게 거래하십시오. 진지한 트레이더를 위해 독점적으로 제작된 이 지표는 ICT Concepts(Inner Circle Trader)의 핵심 기둥인 매우 효과적인 Candle Range Theory(CRT)를 자동화하고 Malaysian Support and Resistance(SnR) 진입 방법과 FVG(Imbalance) 영역의 치명적인 정밀도로 이를 강화합니다. MT4 또는 MT5에서 Forex, Crypto 또는 지수를 거래하든 이 알고리즘은 시장 소음을 제거하고 가짜 돌파(fakeout)
M1 Sniper
Oleg Rodin
4.97 (30)
M1 SNIPER 는 사용하기 쉬운 거래 지표 시스템입니다. M1 시간대에 맞춰 설계된 화살표 지표입니다. 이 지표는 M1 시간대 스캘핑을 위한 단독 시스템으로 사용할 수 있으며, 기존 거래 시스템의 일부로도 사용할 수 있습니다. 이 거래 시스템은 M1 시간대 거래용으로 특별히 설계되었지만, 다른 시간대에도 사용할 수 있습니다. 원래는 XAUUSD와 BTCUSD 거래를 위해 이 방법을 설계했지만, 다른 시장 거래에도 유용하다는 것을 알게 되었습니다. 이 지표의 신호는 추세 방향과 반대로 거래될 수 있습니다. 저는 지표의 신호를 활용하여 양방향으로 거래할 수 있도록 돕는 특별한 거래 기법을 알려드립니다. 이 방법은 특별한 동적 지지선과 저항선 가격 영역을 활용하는 것을 기반으로 합니다. 구매하시면 M1 SNIPER 화살표 지표를 바로 다운로드하실 수 있습니다. 또한, 아래 스크린샷에 표시된 Apollo Dynamic SR 지표는 M1 SNIPER 도구를 사용하는 모든 사용자에게 무료로
PRO Renko System
Oleg Rodin
5 (31)
PRO Renko System 은 RENKO 차트 거래를 위해 특별히 고안된 매우 정확한 거래 시스템입니다. 이것은 다양한 거래 상품에 적용될 수있는 보편적 인 시스템입니다. 체계는 효과적으로 당신에게 정확한 반전 신호에 접근을 주는 소위 시장 소음을 중화합니다. 이 표시기는 사용하기가 매우 쉽고 신호 생성을 담당하는 매개 변수가 하나만 있습니다. 당신은 쉽게 당신의 선택의 어떤 무역 계기에 공구를 적응시킬 수 있고 renko 막대기의 크기. 나는 항상 당신이 내 소프트웨어로 수익성있게 거래 할 수 있도록 추가 지원을 제공 할 준비가되어 있습니다! 나는 당신에게 행복하고 수익성있는 거래를 기원합니다! 구매 후 저에게 연락하십시오! 내 렌코 차트 생성기를 보내드립니다. 또한 내 개인 권장 사항 및 시스템의 다른 모듈을 무료로 공유 할 것입니다!
Scalper Vault
Oleg Rodin
5 (39)
Scalper Vault 는 성공적인 스캘핑에 필요한 모든 것을 제공하는 전문 스캘핑 시스템입니다. 이 표시기는 외환 및 바이너리 옵션 거래자가 사용할 수 있는 완전한 거래 시스템입니다. 권장 시간 프레임은 M5입니다. 시스템은 추세 방향으로 정확한 화살표 신호를 제공합니다. 또한 상단 및 하단 신호와 Gann 시장 수준을 제공합니다.  이 시스템은 사용하기가 매우 쉽습니다. 원하는 시장 지역의 화살표만 따라가면 됩니다. 엑시트는 가격이 적정 수준에 도달하거나 시장의 고점 또는 저점 신호가 나타날 때 수행됩니다.  표시기는 PUSH 알림을 포함한 모든 유형의 경고를 제공합니다. 인디케이터 구매 후 연락주세요. 내 개인 거래 권장 사항과 훌륭한 보너스 지표를 무료로 공유합니다! 나는 당신에게 행복하고 유익한 거래를 기원합니다!
Advanced Currency IMPULSE with ALERT
Bernhard Schweigert
4.9 (491)
현재 40% 할인!! 초보자 또는 전문가 트레이더를 위한 최고의 솔루션! 이 지표는 우리가 독점 기능과 비밀 공식을 통합했기 때문에 독특하고 고품질이며 저렴한 거래 도구입니다. 단 하나의 차트로 28개 통화 쌍 모두에 대한 경고를 제공합니다. 새로운 추세 또는 스캘핑 기회의 정확한 트리거 포인트를 정확히 찾아낼 수 있기 때문에 거래가 어떻게 개선될지 상상해 보십시오! 새로운 기본 알고리즘을 기반으로 구축되어 잠재적인 거래를 훨씬 더 쉽게 식별하고 확인할 수 있습니다. 이는 통화의 강세 또는 약세가 가속되는지 여부를 그래픽으로 표시하고 가속 속도를 측정하기 때문입니다. 자동차의 속도계처럼 생각하면 됩니다. 가속화할 때 Forex 시장에서 동일한 일이 분명히 더 빠르게 발생합니다. 즉, 반대 방향으로 가속화되는 통화를 페어링하면 잠재적으로 수익성 있는 거래를 식별한 것입니다. 통화 모멘텀의 수직선과 화살표가 거래를 안내합니다! 역동적인 Market Fibonacci 23 레벨은
PZ Swing Trading
PZ TRADING SLU
5 (4)
Protect against whipsaws: revolutionize your swing trading approach Swing Trading is the first indicator designed to detect swings in the direction of the trend and possible reversal swings. It uses the baseline swing trading approach, widely described in trading literature. The indicator studies several price and time vectors to track the aggregate trend direction and detects situations in which the market is oversold or overbought and ready to correct. [ Installation Guide | Update Guide | Tro
Introduction to Fractal Pattern Scanner Fractal Indicator refers to the technical indicator that makes use of the fractal geometry found in the financial market. Fractal Pattern Scanner is the advanced Fractal Indicator that brings the latest trading technology after the extensive research and development work in the fractal geometry in the financial market. The most important feature in Fractal Pattern Scanner is the ability to measure the turning point probability as well as the trend probabi
This is a professional chart indicator designed for traders focused on stability and clear price action. It helps filter market noise and provides clear visual entry and exit zones for your trading decisions. Core Features: Strictly Non-Repainting: The system is built with strict non-repaint logic. What you see on the chart is the true historical performance. Confirmed Signals: Signals are triggered and confirmed only after the candle closes . Once a trading arrow appears on a closed candle, it
Apollo SR Master
Oleg Rodin
5 (3)
Apollo SR Master는 지지/저항 구간에서의 거래를 더욱 쉽고 안정적으로 만들어 주는 특수 기능을 갖춘 지지/저항 지표입니다. 이 지표는 지역 가격의 고점과 저점을 감지하여 시간 지연 없이 실시간으로 지지/저항 구간을 계산합니다. 새롭게 형성된 저항 구간을 확인하기 위해 지표는 해당 저항 구간을 실제 매도 또는 매수 신호로 활용할 수 있음을 나타내는 특수 신호를 표시합니다. 이 경우, 저항 구간의 강도가 높아지고, 따라서 저항 구간에서의 성공적인 거래 가능성도 높아집니다. 이것이 바로 이 지표의 핵심 아이디어입니다. SR 존은 손절매와 이익실현을 더욱 쉽게 할 수 있도록 해줍니다. 신호 방향에 따라 SR 존 위 또는 아래 공간을 손절매로 활용할 수 있습니다. 또한, 반대쪽 SR 존은 잠재적 이익실현 영역으로 활용할 수 있습니다. 또한 Apollo SR Master 지표를 사용하는 모든 사용자에게 "Apollo Price Action System" 지표를 무료로 제공합니다.
Trend Catcher ind
Ramil Minniakhmetov
5 (11)
트렌드 캐처 인디케이터 트렌드 캐처 인디케이터는 개발자가 자체 개발한 맞춤형 적응형 트렌드 분석 지표들을 조합하여 시장 가격 움직임을 분석합니다. 단기적인 노이즈를 제거하고 근본적인 모멘텀 강도, 변동성 확대, 가격 구조 움직임에 집중하여 진정한 시장 방향을 파악합니다. 또한 이동 평균, RSI, 변동성 필터와 같은 맞춤형 지표들을 활용하여 가격을 평활화하고 트렌드를 필터링합니다. 실제 운영 모니터링 및 기타 제품은 다음 링크에서 확인하실 수 있습니다: https://www.mql5.com/en/users/mechanic/seller 텔레그램에서는 EA나 설정 파일을 판매하지 않습니다. 사기이니 주의하세요. 모든 설정 파일은 블로그에서 무료로 제공됩니다. 중요! 구매 후 즉시 연락 주시면 사용 방법 및 보너스를 드립니다!
DayTrader PRO MT4
Davit Beridze
4.6 (10)
DayTrader PRO MT5:  https://www.mql5.com/en/market/product/186222 DayTrader PRO는 존 에러스(John Ehlers)의 Laguerre 필터와 강력한 자동 최적화 엔진을 결합한 고급 트레이딩 지표입니다. 고정된 파라미터를 사용하는 대신, 최근 시장 상황을 바탕으로 최적의 설정을 자동으로 검색하므로 지속적인 수동 조정 없이도 변화하는 시장 변동성에 대응할 수 있습니다. 이 지표는 명확한 매수(BUY) 및 매도(SELL) 신호를 생성하며, 현재 시장 변동성을 기준으로 계산된 적응형 손절매(Stop Loss) 및 익절(Take Profit) 레벨을 제공합니다. 내장된 추세, 효율성 지수(Efficiency Ratio), 변동성 및 캔들 필터 기능은 저품질의 진입 신호를 제거하여 신호의 정확도를 높여줍니다. 실시간 성능 대시보드에서는 현재 최적화된 설정값, 수익 요인(Profit Factor), 승률(Win Rate), 최대 낙폭
Smart Trend Trading System
Issam Kassas
4.8 (10)
Smart Trend Trading System은 추세 정보, 진입·청산 신호, 가격 수준을 하나의 차트에 표시하는 MetaTrader 4용 지표입니다. 이 시스템은 추세 감지, 반전 구간, Smart Cloud, 트레일링 스톱 로직, 지지와 저항, 캔들 색상 표시, 알림, 다중 시간대 분석 등 10개 이상의 트레이딩 도구 를 하나의 시스템으로 결합합니다. 이 시스템은 다양한 시장 상황에서 거래를 돕도록 설계되었습니다: 추세장: 주요 추세를 식별하고, 되돌림을 감지하며, 모멘텀을 따라가고, 손절 가이드와 트레일링 스톱 옵션을 사용해 더 깔끔한 진입 지점을 찾습니다. 횡보장: 박스권 시장 상황을 감지하고, 반응 구간을 식별하며, 가격이 중요한 레벨에서 반응할 때 더 명확한 신호를 받을 수 있습니다. 스캘핑 및 인트라데이 거래: 빠른 신호, 캔들 색상, 알림, 다중 시간대 확인을 사용하여 단기 거래 결정을 지원합니다. 주요 기능: • 10개 이상의 인디케이터를 하나의 트레이딩 시스
Top Bottom Tracker MT4
Rodrigo Arana Garcia
탑 바텀 트래커는 시장 추세를 분석하고 추세의 고점과 저점을 감지할 수 있는 정교한 알고리즘을 기반으로 하는 지표입니다 / MT5 버전 . 가격은 500$에 도달할 때까지 점진적으로 상승합니다. 다음 가격 --> $99 특징 다시 칠하지 않음 이 표시기는 새 데이터가 도착해도 값을 변경하지 않습니다 거래 쌍 모든 외환 쌍 기간 모든 기간 파라미터 ==== 인디케이터 구성 ==== 구성 매개 변수 // 40 (값이 높을수록 신호가 적지만 더 정확한 신호가 제공됩니다) 상위 레벨 값 // 80 (상단 수평선의 값) 하단 레벨 값 // 20 (하단 수평선 값) 인디케이터 계산 막대 수 // 3000 (인디케이터를 계산할 막대 수). 값 0은 모든 막대에 대해 인디케이터를 계산합니다) ==== 알람 구성 ==== 팝업 알림 // 참(터미널에서 알람) 이메일 알림 // 참(이메일로 알람 전송) 알람 시간 간격 // 10 (분 단위의 알람 간격) 경고
KURAMA GOLD SIGNAL PRO (MT4) — 7중 필터 · 자동 TP/SL · 품질 점수 · 시그널 기록 저장 | XAUUSD 완전 트레이딩 시스템 실시간 리페인트 없음. 시그널이 나타나는 순간 화살표, 진입, TP, SL이 그 자리에 고정되어 이후 절대 움직이지 않습니다. 여러분이 거래하는 것은 바로 이 실시간 시그널입니다. 그리고 v7.20에서는 실제로 발신된 모든 시그널이 자동 저장되어 재시작 후에도 정확히 복원됩니다. 구매자 전용 보너스 평생 라이선스를 구매하시면 AI Zone Radar($59 상당) + 완전 PDF 매뉴얼을 무료로 드립니다. 제품 가격에 더해 $59 상당의 보너스가 따라옵니다. 구매 후 MQL5로 메시지를 보내주세요. AI Zone Radar: https://www.mql5.com/en/market/product/175834 골드 트레이더 커뮤니티에서 실제로 사용되며 정확성과
Quantum Breakout Indicator PRO
Bogdan Ion Puscasu
4.96 (26)
소개       Quantum Breakout PRO   , 브레이크아웃 존 거래 방식을 변화시키는 획기적인 MQL5 지표! 13년 이상의 거래 경험을 가진 숙련된 트레이더 팀이 개발한   Quantum Breakout PRO는   혁신적이고 역동적인 브레이크아웃 영역 전략으로 거래 여정을 새로운 차원으로 끌어올리도록 설계되었습니다. Quantum Breakout Indicator는 5개의 이익 목표 영역이 있는 브레이크아웃 영역의 신호 화살표와 브레이크아웃 상자를 기반으로 한 손절 제안을 제공합니다. 초보자 거래자와 전문 거래자 모두에게 적합합니다. Quantum EA 채널:       여기를 클릭하세요 MT5 버전 :   여기를 클릭하세요 중요한! 구매 후 설치 매뉴얼을 받으려면 개인 메시지를 보내주십시오. 추천: 기간: M15 통화쌍: GBPJPY, EURJPY, USDJPY,NZDUSD, XAUUSD 계정 유형: 스프레드가 매우 낮은 ECN, Raw 또는 Razo
ARTEMIS 서브 윈도우 리버설 시스템 은 리페인트가 없는 강력한 외환(Forex) 지표로, Smart Money Concepts(스마트 머니 개념)와 스토캐스틱 모멘텀 분석을 결합하여 고확률의 반전 거래를 식별하도록 설계되었습니다. 정확한 진입을 원하는 트레이더를 위해 개발된 이 인디케이터는 유동성 스윕 탐지, 시장 구조 변화, 모멘텀 확인을 하나의 깔끔하고 전문적인 트레이딩 도구로 통합합니다. 이 인디케이터가 돋보이는 이유 대부분의 인디케이터는 무작위 신호를 제공합니다. 하지만 ARTEMIS는 실제 시장 움직임에 집중합니다: 유동성 스윕(스탑 헌팅) 감지 구조 변화(ChoCH) 확인 K/D 크로스를 통한 타이밍 결정 명확한 매수/매도 화살표 제공 리페인트 없는 로직 구조 이로 인해 불필요한 가짜 신호가 줄고, 더 높은 품질의 매매 기회가 생성됩니다. 완벽한 매수 신호 시스템 (핵심 강점) 이 인디케이터는 특히 매수 진입에서 강력합니다: 1단계: 약한 하락 모멘텀 스토캐스틱 K와
Introducing the POWER TRADE Indicator Created by a small group of experienced traders with years of profitable experience in the financial markets, the Power Trade Indicator is a plug-and-play trading tool designed to help traders spot high-quality setups with ease and confidence. What It Does: It provides powerful entry signals, profit-taking zones, and rebound areas — giving you a complete view of where price action is most likely to move next. The indicator reacts in real time, al
ORB Opening Range Breakout MT4
Robby Suhendrawan
4.5 (2)
MT4 최고의 오프닝 레인지 브레이크아웃(ORB) 지표로 시장 개장을 마스터하세요! 오프닝 레인지 브레이크아웃(ORB) 은 전 세계 전문 트레이더들이 사용하는 가장 강력하고 검증된 데이트레이딩 전략 중 하나입니다. 이 지표는 3개의 주요 외환 세션(아시아, 伦敦/런던, 뉴욕)의 오프닝 레인지를 식별, 매핑 및 추적하는 프로세스를 완전히 자동화하여 폭발적인 일일 움직임을 포착하는 데 엄청난 우위를 제공합니다. 무료 EA ORB 다운로드 링크: https://www.mql5.com/en/market/product/187907 정밀함, 깨끗한 시각적 미학, 스마트 알림 시스템으로 설계된 이 도구는 차트를 깔끔하게 유지하면서 고 확률의 돌파구를 절대 놓치지 않도록 보장합니다. 주요 특징 및 장점: 멀티 세션 마스터리: 아시아, 런던, 뉴욕 세션의 오프닝 레인지를 자동으로 플롯합니다. 완전한 사용자 지정 타이밍: 경직된 브로커 서버 시간에 의존하지 마세요. 절대적인 정확성을 위해 정확한 시작
Harmonic Pattern Plus MT4
Young Ho Seo
4.44 (18)
Introduction Harmonic Patterns are best used to predict potential turning point. Traditionally, Harmonic Pattern was identified manually connecting peaks and troughs points in the chart. Manual harmonic pattern detection is painfully tedious and not suitable for everyone. You are often exposed under subjective pattern identification with manual pattern detection. To avoid these limitations, Harmonic Pattern Plus was designed to automate your harmonic pattern detection process. The functionality
Volume Break Oscillator는 가격 움직임을 오실레이터 형태로 볼륨 추세와 일치시키는 지표입니다. 저는 볼륨 분석을 제 전략에 통합하고 싶었지만 OBV, Money Flow Index, A/D, Volume Weighted Macd 및 기타 여러 지표와 같은 대부분의 볼륨 지표에 항상 실망했습니다. 그래서 저는 이 지표를 직접 작성했고, 얼마나 유용한지 만족스러워서 시장에 공개하기로 결정했습니다. 주요 기능: 가격이 볼륨 증가(브레이크)로 지원되는 방향으로 움직이는 단계를 강조합니다. 볼륨 증가가 멈추고 시장이 수축되는 단계를 강조합니다. 특히 시간 프레임(<=15분)이 있는 일중 거래에서 가격이나 볼륨이 움직이지 않아 시장이 향후 상승에 대비하는 단계를 강조합니다. 볼륨 증가로 지원되지 않는 다른 전문가 자문가의 거짓 신호를 걸러냅니다. 추세와 범위 단계를 시각화하는 것이 매우 쉽습니다. 입력 매개변수: 계산 설정: 계산 유형: FAST, NORMAL, S
Scalper Inside PRO
Alexey Minkov
4.74 (69)
Scalper Inside PRO helps you read the intraday trend and plan a trade before you enter the market. It is built around three exclusive strategies for a sharper read of the market. The moment a signal appears, the indicator evaluates market direction and calculates the key levels, so you see the potential entry, the expected stop-loss and several profit-taking levels in advance. Detailed performance statistics show how different instruments and strategies performed in history and help you pick ass
PZ Trend Trading
PZ TRADING SLU
4.8 (5)
Capture every opportunity: your go-to indicator for profitable trend trading Trend Trading is an indicator designed to profit as much as possible from trends taking place in the market, by timing pullbacks and breakouts. It finds trading opportunities by analyzing what the price is doing during established trends. [ Installation Guide | Update Guide | Troubleshooting | FAQ | All Products ] Trade financial markets with confidence and efficiency Profit from established trends without getting whips
제작자의 제품 더 보기
Structure Pulse SMC
Andrei Strashko
5 (1)
Structure Pulse SMC Structure Pulse SMC is a multifunctional indicator for MetaTrader 5 that combines market structure, liquidity, trend, and volume analysis in one visual system. It helps traders assess current market conditions faster, identify potential entry points, and plan trade management levels in advance. Instead of using multiple separate indicators and manually drawn lines, Structure Pulse SMC creates a complete market picture directly on the chart: structural direction, key level br
Structure Pulse SMC Structure Pulse SMC is a multifunctional indicator for MetaTrader 4 that combines market structure, liquidity, trend, and volume analysis in one visual system. It helps traders assess current market conditions faster, identify potential entry points, and plan trade management levels in advance. Instead of using multiple separate indicators and manually drawn lines, Structure Pulse SMC creates a complete market picture directly on the chart: structural direction, key level bre
Second and Custom Timeframe Charts See the market between standard timeframes. Second and Custom Timeframe Charts is a professional chart utility for MetaTrader 4 that creates synthetic candles for non-standard timeframes directly from market data. It is designed for traders who need more flexibility than the default MT4 timeframe set can provide. Standard charts show only fixed periods. But the market does not always move in standard blocks. Sometimes the most important structure is visible on
Trade Assistant MT4/MT5 PRO 는 MetaTrader 4/5용 전문 트레이딩 패널입니다. 빠르고 편리하며 시각적으로 명확하게 거래를 제어하고 싶은 트레이더를 위해 제작되었습니다. 이 제품은 반복적인 수동 작업을 줄이고, 주문 실행과 관리 속도를 높이며, 리스크 관리를 표준화하고, 수동 트레이딩을 더 규율 있게 만들어 줍니다. 이 도구는 트레이더 대신 매매 신호를 찾지 않으며, 마법 같은 결과를 약속하지도 않습니다. 역할은 훨씬 더 실용적입니다. 차트 위에서 바로 사용할 수 있는 편리한 트레이딩 인프라를 제공하는 것입니다. 진입 지점, 거래 아이디어, 시장 논리는 트레이더가 직접 선택합니다. Trade Assistant MT4/MT5 PRO는 그 아이디어를 명확한 리스크, 포지션 크기, Stop Loss, Take Profit, Breakeven, Trailing Stop, 포지션 관리가 포함된 정확한 거래 계획으로 빠르게 전환하도록 도와줍니다. 매번 포지션 크기를
MA EMA Cross Risk EA 는 명확하고 논리적이며 시각적으로 이해하기 쉬운 이동평균선 교차 전략으로 거래하고자 하는 사용자를 위해 제작된 MetaTrader 5용 자동매매 프로그램입니다. 이 EA는 기술적 분석에서 가장 잘 알려진 개념 중 하나인 빠른 MA/EMA와 느린 MA/EMA의 교차를 기반으로 합니다. 시장의 방향이 바뀔 때 이동평균선은 불필요한 노이즈와 감정적 판단, 수동 신호 검색 없이 이러한 변화를 파악하는 데 도움을 줍니다. EA는 Moving Average 또는 Exponential Moving Average의 교차를 자동으로 감지하고 설정된 규칙에 따라 거래를 시작합니다. 사용자는 이동평균선의 종류, 기간, Stop Loss, Take Profit 및 거래당 위험 비율을 직접 설정할 수 있습니다. 따라서 안정적인 시스템 거래뿐만 아니라 다양한 시장 환경에서의 적극적인 테스트에도 활용할 수 있습니다. MA EMA Cross Risk EA 의 핵심 개념은 거
FREE
CandleCloseTimer — 캔들 마감까지 남은 시간을 완벽하게 관리 CandleCloseTimer는 현재 캔들이 마감될 때까지 남은 시간을 차트에 직접 표시하는 MetaTrader 5용 компакт한 유틸리티입니다. 타이머는 현재 가격 근처에 표시되므로 트레이더가 가장 자주 확인하는 가격 스케일 주변에서 필요한 정보를 항상 확인할 수 있습니다. 이 유틸리티는 거래를 실행하지 않고, 매매 신호를 제공하지 않으며, 플랫폼의 작동에 개입하지 않습니다. 선택한 타임프레임에서 현재 캔들이 마감될 때까지 정확히 얼마나 남았는지를 보여주는 것이 주요 목적입니다. CandleCloseTimer의 주요 기능 1. 현재 캔들 마감까지의 타이머 현재 캔들이 마감될 때까지 남은 시간을 00:00:00 형식으로 표시합니다. 2. 현재 가격 근처에 표시 타이머를 가격 스케일 근처 또는 현재 가격 아래에 배치할 수 있어 차트 분석을 방해하지 않습니다. 3. 타임프레임 자동 전환 M1, M5, M15,
FREE
Gold Wolf EA
Andrei Strashko
Gold Wolf EA — Automated Gold Trading Expert Advisor for MT4 / MT5 Gold Wolf EA is an automated trading Expert Advisor for MetaTrader 4 and MetaTrader 5, developed for trading XAUUSD based on trend-following logic, market condition filtering, and controlled risk management. The EA is not designed for aggressive high-frequency trading. Its main objective is to identify suitable market conditions, avoid unnecessary entries, and trade only when the internal strategy conditions are met. Gold Wolf EA
Sar Manager MT5
Andrei Strashko
SAR Manager SAR Manager는 표준 Parabolic SAR 알고리즘을 기반으로 하는 MetaTrader 5용 시그널 인디케이터입니다. 이 인디케이터는 SAR 방향의 변화를 감지하고, 가상 BUY 및 SELL 시그널을 생성하며, Stop Loss와 Take Profit 레벨을 계산하여 관련 정보를 차트에 직접 표시합니다. 이 제품은 시장 분석과 수동 거래 지원을 목적으로 합니다. 실제 거래 주문을 개설, 수정 또는 종료하지 않습니다. 시그널 계산 Parabolic SAR 포인트가 가격 위쪽에서 아래쪽으로 이동하면 BUY 시그널이 확정됩니다. SAR 포인트가 가격 아래쪽에서 위쪽으로 이동하면 SELL 시그널이 확정됩니다. 새로운 시그널은 캔들이 종료된 후에만 계산됩니다. 현재 형성 중인 캔들은 진입 확인에 사용되지 않습니다. 가상 진입 가격은 SAR 방향 전환이 확정된 다음 캔들의 시가를 기준으로 결정됩니다. 인디케이터는 한 번에 하나의 가상 포지션만 추적합니다. 포지션
FREE
MA EMA Cross Risk EA 는 명확하고 논리적이며 시각적으로 이해하기 쉬운 이동평균선 교차 전략으로 거래하고자 하는 사용자를 위해 제작된 MetaTrader 4용 자동매매 프로그램입니다. 이 EA는 기술적 분석에서 가장 잘 알려진 개념 중 하나인 빠른 MA/EMA와 느린 MA/EMA의 교차를 기반으로 합니다. 시장의 방향이 바뀔 때 이동평균선은 불필요한 노이즈와 감정적 판단, 수동 신호 검색 없이 이러한 변화를 파악하는 데 도움을 줍니다. EA는 Moving Average 또는 Exponential Moving Average의 교차를 자동으로 감지하고 설정된 규칙에 따라 거래를 시작합니다. 사용자는 이동평균선의 종류, 기간, Stop Loss, Take Profit 및 거래당 위험 비율을 직접 설정할 수 있습니다. 따라서 안정적인 시스템 거래뿐만 아니라 다양한 시장 환경에서의 적극적인 테스트에도 활용할 수 있습니다. MA EMA Cross Risk EA 의 핵심 개념은 거
FREE
Astra BB RSI Arrows — 볼린저 밴드와 RSI를 활용한 정밀한 시각적 트레이딩 신호 인디케이터 Astra BB RSI Arrows는 시장에서 잠재적인 진입 및 청산 지점을 명확하고 빠르게 찾고자 하는 트레이더를 위해 개발된 인디케이터입니다. 이 인디케이터는 기술적 분석에서 널리 사용되는 두 가지 도구인 볼린저 밴드와 RSI를 결합합니다. 여러 창을 계속 전환하면서 교차 신호, 과매수 구간, 과매도 구간을 수동으로 확인할 필요 없이 필요한 정보를 차트에서 직접 시각적으로 확인할 수 있습니다. 이 인디케이터는 불필요한 요소로 거래 플랫폼을 복잡하게 만들지 않습니다. 볼린저 밴드 라인, 진입 화살표, 시각적 청산 신호, 주요 시장 상황을 놓치지 않도록 도와주는 알림 등 필요한 정보만 표시합니다. Astra BB RSI Arrows의 기본 개념 가격이 극단적인 구간에 진입한 후 정상 범위로 되돌아오기 시작할 때 시장에서는 유용한 거래 기회가 나타날 수 있습니다. 이 인디케이터
FREE
Universal Trade Copier MT5 는 동일한 컴퓨터 또는 VPS에서 실행되는 MetaTrader 4와 MetaTrader 5 터미널 간에 거래를 복사하도록 설계된 전문 로컬 거래 복사 유틸리티입니다. 이 제품은 다음과 같은 여러 복사 방향을 지원합니다. MT4 → MT4 MT5 → MT5 MT4 → MT5 MT5 → MT4 이 버전은 MetaTrader 5용으로 설계되었습니다. MetaTrader 4 터미널이 포함된 거래를 복사하려면 별도의 호환 MT4 버전이 필요합니다. 이 복사기는 여러 계좌를 관리하거나, 다양한 MetaTrader 터미널과 브로커를 사용하거나, MT4와 MT5 계좌 간에 거래를 복사해야 하는 트레이더에게 적합합니다. User Guide   사용자 가이드 주요 기능 시장가 주문 복사: Buy 및 Sell. 예약 주문 복사: Buy Limit, Sell Limit, Buy Stop, Sell Stop. Stop Loss 및 Take Profit 복사
Adaptive Pulse 는 MetaTrader 4용 적응형 추세 지표로, 현재 시장 방향을 파악하고 약한 움직임을 필터링하며 확정된 진입 및 청산 신호를 차트에 직접 표시합니다. 시장은 끊임없이 변합니다. 변동성이 낮은 구간에서는 가격이 천천히 움직이면서 많은 잘못된 신호가 발생할 수 있습니다. 반대로 변동성이 높은 상황에서는 일반적인 추세선이 시장 변화에 늦게 반응할 수 있습니다. Adaptive Pulse는 현재 시장 상황에 따라 민감도를 자동으로 조정합니다. 횡보 구간에서는 선이 더욱 부드럽게 움직이고, 강한 방향성 움직임이 발생하면 가격 변화에 더 빠르게 반응합니다. 이 지표는 가격 움직임의 효율성, 단기 및 장기 변동성, 적응형 추세선의 기울기, 추세 강도를 분석합니다. 신호는 캔들이 완전히 마감된 후에만 확정됩니다. 이미 형성된 과거 신호는 이후 이동하거나 사라지거나 변경되지 않습니다. Adaptive Pulse 작동 방식 적응형 추세선은 현재 시장 방향에 따라 색상이
FREE
Session Atlas MT5
Andrei Strashko
Session Atlas — MetaTrader 5용 전문 거래 세션 맵 Session Atlas는 일반 차트를 명확한 거래 시간 지도로 바꿔 주는 MT5용 시각화 인디케이터입니다. 주요 거래 세션의 시작, 종료 및 활성 상태를 차트에 직접 표시하여 현재 시장이 아시아, 유럽 또는 미국 세션 중 어느 단계에 있는지 빠르게 파악할 수 있도록 도와줍니다. 많은 트레이더가 가격대, 모멘텀, 돌파 및 변동성을 분석하지만, 중요한 요소인 시간을 놓치는 경우가 많습니다. 동일한 신호라도 아시아, 유럽 및 미국 세션에서는 전혀 다르게 움직일 수 있습니다. Session Atlas는 수동 표시, 반복적인 시간 확인, 불필요한 시각적 요소 없이 시장의 시간적 맥락을 즉시 확인할 수 있도록 합니다. 인디케이터는 거래 세션을 차트에 색상 영역으로 자동 표시합니다. 각 영역은 해당 세션의 시간대와 가격 움직임 범위를 보여 주며, 서로 다른 시장 단계를 시각적으로 구분합니다. 이를 통해 시장이 조용했던 구
FREE
Astra BB RSI Arrows MT4
Andrei Strashko
1 (1)
Astra BB RSI Arrows — 볼린저 밴드와 RSI를 활용한 정밀한 시각적 트레이딩 신호 인디케이터 Astra BB RSI Arrows는 시장에서 잠재적인 진입 및 청산 지점을 명확하고 빠르게 찾고자 하는 트레이더를 위해 개발된 인디케이터입니다. 이 인디케이터는 기술적 분석에서 널리 사용되는 두 가지 도구인 볼린저 밴드와 RSI를 결합합니다. 여러 창을 계속 전환하면서 교차 신호, 과매수 구간, 과매도 구간을 수동으로 확인할 필요 없이 필요한 정보를 차트에서 직접 시각적으로 확인할 수 있습니다. 이 인디케이터는 불필요한 요소로 거래 플랫폼을 복잡하게 만들지 않습니다. 볼린저 밴드 라인, 진입 화살표, 시각적 청산 신호, 주요 시장 상황을 놓치지 않도록 도와주는 알림 등 필요한 정보만 표시합니다. Astra BB RSI Arrows의 기본 개념 가격이 극단적인 구간에 진입한 후 정상 범위로 되돌아오기 시작할 때 시장에서는 유용한 거래 기회가 나타날 수 있습니다. 이 인디케이터
FREE
Sar Manager MT4
Andrei Strashko
SAR Manager SAR Manager는 표준 Parabolic SAR 알고리즘을 기반으로 하는 MetaTrader 4용 신호 인디케이터입니다. 이 인디케이터는 SAR 방향의 변화를 감지하고, 가상 BUY 및 SELL 신호를 생성하며, Stop Loss와 Take Profit 수준을 계산하고 관련된 모든 정보를 차트에 직접 표시합니다. 이 제품은 시장 분석과 수동 거래 지원을 목적으로 합니다. 실제 거래 주문을 개설하거나 수정하거나 청산하지 않습니다. 신호 계산 Parabolic SAR 포인트가 가격 위에서 가격 아래로 이동하면 BUY 신호가 확정됩니다. SAR 포인트가 가격 아래에서 가격 위로 이동하면 SELL 신호가 확정됩니다. 새로운 신호는 캔들이 마감된 후에만 계산됩니다. 현재 형성 중인 캔들은 진입 확인에 사용되지 않습니다. 가상 진입 가격은 SAR 방향 전환이 확인된 다음 캔들의 시가를 기준으로 결정됩니다. 인디케이터는 한 번에 하나의 가상 포지션만 추적합니다. 포지션
FREE
Adaptive Pulse 는 MetaTrader 5용 적응형 추세 지표로, 현재 시장 방향을 파악하고 약한 움직임을 필터링하며 확정된 진입 및 청산 신호를 차트에 직접 표시합니다. 시장은 끊임없이 변합니다. 변동성이 낮은 구간에서는 가격이 천천히 움직이면서 많은 잘못된 신호가 발생할 수 있습니다. 반대로 변동성이 높은 상황에서는 일반적인 추세선이 시장 변화에 늦게 반응할 수 있습니다. Adaptive Pulse는 현재 시장 상황에 따라 민감도를 자동으로 조정합니다. 횡보 구간에서는 선이 더욱 부드럽게 움직이고, 강한 방향성 움직임이 발생하면 가격 변화에 더 빠르게 반응합니다. 이 지표는 가격 움직임의 효율성, 단기 및 장기 변동성, 적응형 추세선의 기울기, 추세 강도를 분석합니다. 신호는 캔들이 완전히 마감된 후에만 확정됩니다. 이미 형성된 과거 신호는 이후 이동하거나 사라지거나 변경되지 않습니다. Adaptive Pulse 작동 방식 적응형 추세선은 현재 시장 방향에 따라 색상이
FREE
CandleCloseTimer — 캔들 마감까지 남은 시간을 완벽하게 관리 CandleCloseTimer는 현재 캔들이 마감될 때까지 남은 시간을 차트에 직접 표시하는 MetaTrader 4용 компакт한 유틸리티입니다. 타이머는 현재 가격 근처에 표시되므로 트레이더가 가장 자주 확인하는 가격 스케일 주변에서 필요한 정보를 항상 확인할 수 있습니다. 이 유틸리티는 거래를 실행하지 않고, 매매 신호를 제공하지 않으며, 플랫폼의 작동에 개입하지 않습니다. 선택한 타임프레임에서 현재 캔들이 마감될 때까지 정확히 얼마나 남았는지를 보여주는 것이 주요 목적입니다. CandleCloseTimer의 주요 기능 1. 현재 캔들 마감까지의 타이머 현재 캔들이 마감될 때까지 남은 시간을 00:00:00 형식으로 표시합니다. 2. 현재 가격 근처에 표시 타이머를 가격 스케일 근처 또는 현재 가격 아래에 배치할 수 있어 차트 분석을 방해하지 않습니다. 3. 타임프레임 자동 전환 M1, M5, M15,
FREE
Turtle Path MT5
Andrei Strashko
Turtle Path MT5 — 시장을 명확하게 파악하고 싶은 트레이더를 위한 인디케이터 Turtle Path MT5는 추측에 의존하지 않고 차트에서 시장 움직임의 구조를 직접 확인하고 싶은 트레이더를 위해 개발되었습니다. 이 인디케이터는 고전적인 터틀 트레이딩 시스템의 논리를 기반으로 하며, 주요 돌파 레벨과 신호 방향, Take Profit 및 Stop Loss 구간을 빠르게 파악할 수 있도록 도와줍니다. 각 신호는 채널 라인, 진입 레벨, 목표가, Stop Loss 및 차트의 화살표를 통해 시각적으로 표시됩니다. 돌파 지점을 직접 찾거나 위험 거리를 계산할 필요가 없습니다. 인디케이터가 이를 자동으로 계산하고 전체적인 시장 상황을 즉시 보여줍니다. Turtle Path MT5는 추세 추종 매매, 돌파 전략을 사용하는 트레이더와 보다 체계적인 매매 결정을 원하는 트레이더에게 특히 유용합니다. 복잡한 차트 대신 신호가 발생한 위치, 위험 구간, 목표가 및 현재 중요한 가격 레벨을
FREE
Turtle Path MT4
Andrei Strashko
Turtle Path MT4 — 시장을 명확하게 파악하고 싶은 트레이더를 위한 인디케이터 Turtle Path MT4는 추측에 의존하지 않고 차트에서 시장 움직임의 구조를 직접 확인하고 싶은 트레이더를 위해 개발되었습니다. 이 인디케이터는 고전적인 터틀 트레이딩 시스템의 논리를 기반으로 하며, 주요 돌파 레벨과 신호 방향, Take Profit 및 Stop Loss 구간을 빠르게 파악할 수 있도록 도와줍니다. 각 신호는 채널 라인, 진입 레벨, 목표가, Stop Loss 및 차트의 화살표를 통해 시각적으로 표시됩니다. 돌파 지점을 직접 찾거나 위험 거리를 계산할 필요가 없습니다. 인디케이터가 이를 자동으로 계산하고 전체적인 시장 상황을 즉시 보여줍니다. Turtle Path MT4는 추세 추종 매매, 돌파 전략을 사용하는 트레이더와 보다 체계적인 매매 결정을 원하는 트레이더에게 특히 유용합니다. 복잡한 차트 대신 신호가 발생한 위치, 위험 구간, 목표가 및 현재 중요한 가격 레벨을
FREE
Second and Custom Timeframe Charts See the market between standard timeframes. Second and Custom Timeframe Charts is a professional chart utility for MetaTrader 5 that creates synthetic candles for non-standard timeframes directly from market data. It is designed for traders who need more flexibility than the default MT5 timeframe set can provide. Standard charts show only fixed periods. But the market does not always move in standard blocks. Sometimes the most important structure is visible on
Universal Trade Copier MT4 는 동일한 컴퓨터 또는 VPS에서 실행되는 MetaTrader 4와 MetaTrader 5 터미널 간에 거래를 복사하도록 설계된 전문 로컬 거래 복사 도구입니다. 이 제품은 다음과 같은 복사 방향을 지원합니다. MT4 → MT4 MT5 → MT5 MT4 → MT5 MT5 → MT4 이 버전은 MetaTrader 4용으로 설계되었습니다. MetaTrader 5 터미널이 포함된 거래를 복사하려면 별도의 호환 MT5 버전이 필요합니다. 이 거래 복사기는 여러 계좌를 관리하거나, 서로 다른 MetaTrader 터미널을 사용하거나, 여러 브로커와 거래하거나, MT4와 MT5 계좌 간에 거래를 복사하려는 트레이더에게 적합합니다. User Guide 사용자 가이드 주요 기능 Buy 및 Sell 시장가 주문 복사. Buy Limit, Sell Limit, Buy Stop, Sell Stop 예약 주문 복사. Stop Loss 및 Take Profi
Session Atlas MT4
Andrei Strashko
Session Atlas — MetaTrader 4용 전문 거래 세션 맵 Session Atlas는 일반 차트를 명확한 거래일 지도 형태로 바꿔 주는 MT4용 시각적 인디케이터입니다. 주요 거래 세션의 시작, 종료 및 활성 상태를 차트에 직접 표시하여 현재 시장이 아시아, 유럽 또는 미국 세션 중 어느 단계에 있는지 빠르게 파악할 수 있도록 도와줍니다. 많은 트레이더가 가격 수준, 모멘텀, 돌파 및 변동성을 분석하지만 중요한 요소인 시간을 놓치는 경우가 많습니다. 동일한 신호라도 아시아, 유럽 및 미국 세션에서는 전혀 다르게 움직일 수 있습니다. Session Atlas를 사용하면 수동으로 영역을 표시하거나 계속 시간을 확인할 필요 없이, 불필요한 시각적 요소를 추가하지 않고도 시장의 시간적 맥락을 즉시 확인할 수 있습니다. 인디케이터는 거래 세션을 차트에 색상 영역으로 자동 표시합니다. 각 영역은 특정 세션의 시간대와 가격 변동 범위를 보여 주며, 서로 다른 거래 단계를 시각적으로
FREE
Symbol Cost Monitor 는 여러 거래 종목의 거래 비용을 동시에 빠르게 모니터링할 수 있도록 설계된 MetaTrader 5용 전문 분석 유틸리티입니다. 스프레드와 스왑은 최종 거래 결과에 직접적인 영향을 미칩니다. 이는 스캘핑, 활발한 데이 트레이딩, 며칠 동안 포지션을 보유하는 거래, 여러 종목을 동시에 거래하는 경우에 특히 중요합니다. MetaTrader 5의 기본 인터페이스에서는 이러한 모든 항목을 하나의 창에서 편리하게 비교하기 어렵기 때문에, 일반적으로 각 종목의 세부 정보를 개별적으로 열어 수동으로 확인해야 합니다. Symbol Cost Monitor는 선택한 종목의 핵심 데이터를 수집하여 차트 위의 간결한 패널에 표시합니다. 이를 통해 스프레드가 확대된 종목을 빠르게 확인하고, 스왑을 비교하며, 거래 조건의 변화를 모니터링하고, 포지션을 열기 전에 예상 비용을 평가할 수 있습니다. 패널은 데이터를 실시간으로 업데이트하며, Market Watch에 표시된 모든
FREE
Symbol Cost Monitor 는 여러 거래 종목의 거래 비용을 동시에 빠르게 모니터링할 수 있도록 설계된 MetaTrader 4용 전문 분석 유틸리티입니다. 스프레드와 스왑은 최종 거래 결과에 직접적인 영향을 미칩니다. 이는 스캘핑, 활발한 데이 트레이딩, 며칠 동안 포지션을 보유하는 거래, 여러 종목을 동시에 거래하는 경우에 특히 중요합니다. MetaTrader 4의 기본 인터페이스에서는 이러한 모든 항목을 하나의 창에서 편리하게 비교하기 어렵기 때문에, 일반적으로 각 종목의 세부 정보를 개별적으로 열어 수동으로 확인해야 합니다. Symbol Cost Monitor는 선택한 종목의 핵심 데이터를 수집하여 차트 위의 간결한 패널에 표시합니다. 이를 통해 스프레드가 확대된 종목을 빠르게 확인하고, 스왑을 비교하며, 거래 조건의 변화를 모니터링하고, 포지션을 열기 전에 예상 비용을 평가할 수 있습니다. 패널은 데이터를 실시간으로 업데이트하며, Market Watch에 표시된 모든
FREE
Multi-Currency Candlestick Pattern Scanner for MT4 Multi-Currency Candlestick Pattern Scanner for MT4 is a professional multi-currency and multi-timeframe Japanese candlestick pattern scanner for MetaTrader 4. The indicator analyzes multiple trading instruments and timeframes simultaneously, displays detected bullish and bearish candlestick patterns in a dashboard panel, and can also show arrows, text labels, and a Moving Average directly on the active chart. This tool is designed for traders wh
Trade Assistant MT4/MT5 PRO 는 MetaTrader 4/5용 전문 트레이딩 패널입니다. 빠르고 편리하며 시각적으로 명확하게 거래를 제어하고 싶은 트레이더를 위해 제작되었습니다. 이 제품은 반복적인 수동 작업을 줄이고, 주문 실행과 관리 속도를 높이며, 리스크 관리를 표준화하고, 수동 트레이딩을 더 규율 있게 만들어 줍니다. 이 도구는 트레이더 대신 매매 신호를 찾지 않으며, 마법 같은 결과를 약속하지도 않습니다. 역할은 훨씬 더 실용적입니다. 차트 위에서 바로 사용할 수 있는 편리한 트레이딩 인프라를 제공하는 것입니다. 진입 지점, 거래 아이디어, 시장 논리는 트레이더가 직접 선택합니다. Trade Assistant MT4/MT5 PRO는 그 아이디어를 명확한 리스크, 포지션 크기, Stop Loss, Take Profit, Breakeven, Trailing Stop, 포지션 관리가 포함된 정확한 거래 계획으로 빠르게 전환하도록 도와줍니다. 매번 포지션 크기를
Quantum SuperTrend AI is an indicator with AI-powered intelligent signal filtering: the indicator analyzes market conditions, filters out part of weak impulses, and helps traders see a cleaner market picture without unnecessary noise. Quantum SuperTrend AI is a professional trading indicator for MetaTrader 4, created for traders who need a clear visual tool for trend analysis, trading signals, and control of possible exit zones. User Guide The name Quantum SuperTrend AI reflects the core idea
PatternGuard VWAP Trader — a Smart Expert Advisor for Market Structure-Based Trading PatternGuard VWAP Trader is an advanced trading Expert Advisor designed to identify high-quality entry points after price exits a zone of market uncertainty. The strategy is based on a combination of VWAP logic, a NO TRADE zone, candlestick pattern confirmation, trend filtering, and flexible trade management. The EA does not open trades randomly. It analyzes market structure, waits for price to leave a consolida
Gold Wolf EA MT4
Andrei Strashko
Gold Wolf EA — Automated Gold Trading Expert Advisor for MT4 / MT5 Gold Wolf EA is an automated trading Expert Advisor for MetaTrader 4 and MetaTrader 5, developed for trading XAUUSD based on trend-following logic, market condition filtering, and controlled risk management. The EA is not designed for aggressive high-frequency trading. Its main objective is to identify suitable market conditions, avoid unnecessary entries, and trade only when the internal strategy conditions are met. Gold Wolf EA
Golden Wolf Grid PRO is an Expert Advisor for MetaTrader 4 , designed for automated trading on Gold / XAUUSD using the M15 timeframe . The EA is based on a grid trading strategy and is created to work with market fluctuations, opening and managing trades automatically according to the selected parameters. Golden Wolf Grid PRO comes with optimized settings for XAUUSD M15 , so you can use the prepared configuration or perform your own optimization and forward testing according to your broker, acco
필터:
리뷰 없음
리뷰 답변