Visual Tiger Momentum Indicator
- Indicateurs
- AL MOOSAWI ABDULLAH JAFFER BAQER
- Version: 1.0
- Activations: 5
Visual Tiger Momentum Indicator: See the Market's Next Move
Tired of lagging indicators that leave you second-guessing your trades? The Visual Tiger Momentum Indicator is a professional-grade, on-chart analysis tool designed to give you a clear and predictive edge in any market and on any timeframe. By replacing outdated moving averages with advanced statistical analysis, this indicator provides a dynamic, forward-looking view of trend, momentum, and volatility.
For a one-time price of just $30, you can equip your charts with a powerful analytical engine that helps you trade with greater confidence and precision.
The Logic: Beyond Simple Averages
The core of the Visual Tiger Momentum Indicator is a sophisticated Polynomial Regression algorithm. Here is a breakdown of how it works:
-
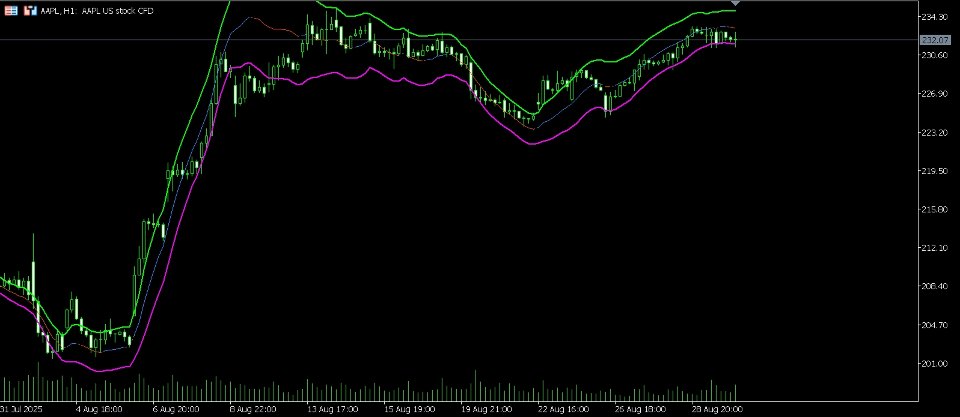
Dynamic Center Line: Instead of a simple moving average that just calculates the mean of past prices, this indicator fits a mathematical curve directly to the price action over a specified period. This results in a center line that is far more responsive to changes in momentum and less prone to lag. It visually represents the true underlying trend of the market.
-
Statistical Volatility Bands: The upper and lower bands are not fixed offsets. They are calculated based on the standard deviation of the price from the central regression line. This means the channel automatically expands during high volatility and contracts during periods of consolidation. This provides an objective, statistical measure of when the market is overbought or oversold.
-
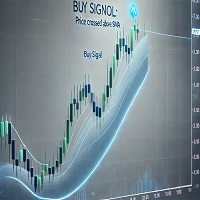
Instant Trend Visualization: The indicator features a unique trend-filling cloud. When the central regression line is sloping upwards, the cloud is colored blue, signaling a clear uptrend. When the line slopes downwards, the cloud turns red, indicating a downtrend. This allows you to assess the market's direction at a single glance.
This combination of predictive curve-fitting and dynamic volatility analysis gives you a comprehensive view of the market that simple indicators cannot match.
How to Trade with the Visual Tiger Momentum Indicator
This tool is incredibly versatile and can be adapted to any trading style. Here are a few powerful strategies:
-
Trend Following: The simplest and most effective way to use the indicator. Trade only in the direction of the trend cloud. Enter long positions when the cloud is blue and the price pulls back to touch the central regression line. Enter short positions when the cloud is red and the price retraces to the central line.
-
Mean Reversion: In ranging or consolidating markets, the outer bands act as powerful reversal zones. When the price touches the upper band, look for signs of exhaustion to enter a short position, targeting the central line. Conversely, a touch of the lower band can signal a buying opportunity.
-
Volatility Breakouts: When the bands contract and become very narrow, it indicates that volatility is low and a significant price move is likely imminent. Position yourself for a breakout and trade in the direction that the price closes decisively outside of the bands.
Key Features
-
Advanced Polynomial Regression Core: A mathematically superior method for identifying the true trend with minimal lag.
-
Dynamic Volatility Channels: The bands automatically adjust to market volatility, providing reliable overbought and oversold levels.
-
At-a-Glance Trend Identification: The colored trend cloud instantly shows you whether you should be looking for buying or selling opportunities.
-
Fully Customizable: Fine-tune every aspect of the indicator to match your specific trading strategy and preferred market.
-
Multiple Price Modes: Analyze the market based on Close, Open, High, Low, Median, Typical, and other price calculation types.
-
Clean, On-Chart Display: The indicator plots directly on your main chart, keeping your workspace clean and your analysis integrated with price.
-
No Repainting: The indicator's calculations are fixed once a bar closes, ensuring you can trust what you see.
Full Control Over Your Analysis: Input Parameters Explained
-
Polynomial Degree: Controls the sensitivity of the central line. A lower degree (e.g., 1-2) creates a smoother line, ideal for identifying long-term trends. A higher degree (e.g., 3-4) creates a more reactive line that closely follows the price, perfect for short-term trading.
-
Channel Width Multiplier: Adjusts the distance of the upper and lower bands. A smaller value brings the bands closer, signaling more frequent reversal opportunities. A larger value widens the bands, highlighting only the most extreme price deviations.
-
Calculation Period: The number of bars used for the regression calculation. A longer period provides a more stable, big-picture view of the trend, while a shorter period focuses on recent momentum.
-
Price Type: Choose which price point the indicator will use for its calculations, allowing you to align its analysis with your system.
-
Horizontal Shift: Shift the indicator forwards or backwards to help with forecasting or historical analysis.
-
Visual Settings: Enable or disable any of the visual components (upper band, lower band, middle line, trend fill) to customize the chart to your liking.
Unlock a more intelligent way to analyze the markets. The Visual Tiger Momentum Indicator is not just another tool; it's a new perspective on price action. Add it to your collection today.

