Easy RSI divergences

📈 Easy RSI Divergences – Unlock Professional-Level Divergence Trading

Easy RSI Divergences is a cutting-edge indicator for MetaTrader 4, crafted for traders who want to gain a competitive edge by accurately identifying RSI (Relative Strength Index) divergences in real time. Whether you are a beginner or a professional, this tool transforms complex market signals into clear, actionable insights.

The indicator automatically detects both classic divergences (indicating potential trend reversals) and hidden divergences (signaling trend continuation), visually highlighting them on your chart with arrows, trend lines, and color-coded signals. Instant pop-up alerts ensure you never miss a high-probability trading opportunity.

Developed under strict coding standards (#property strict), Easy RSI Divergences guarantees stability, accuracy, and smooth performance across any asset or timeframe, setting a new benchmark for professional trading tools.

🔍 Why Divergences Matter in Trading

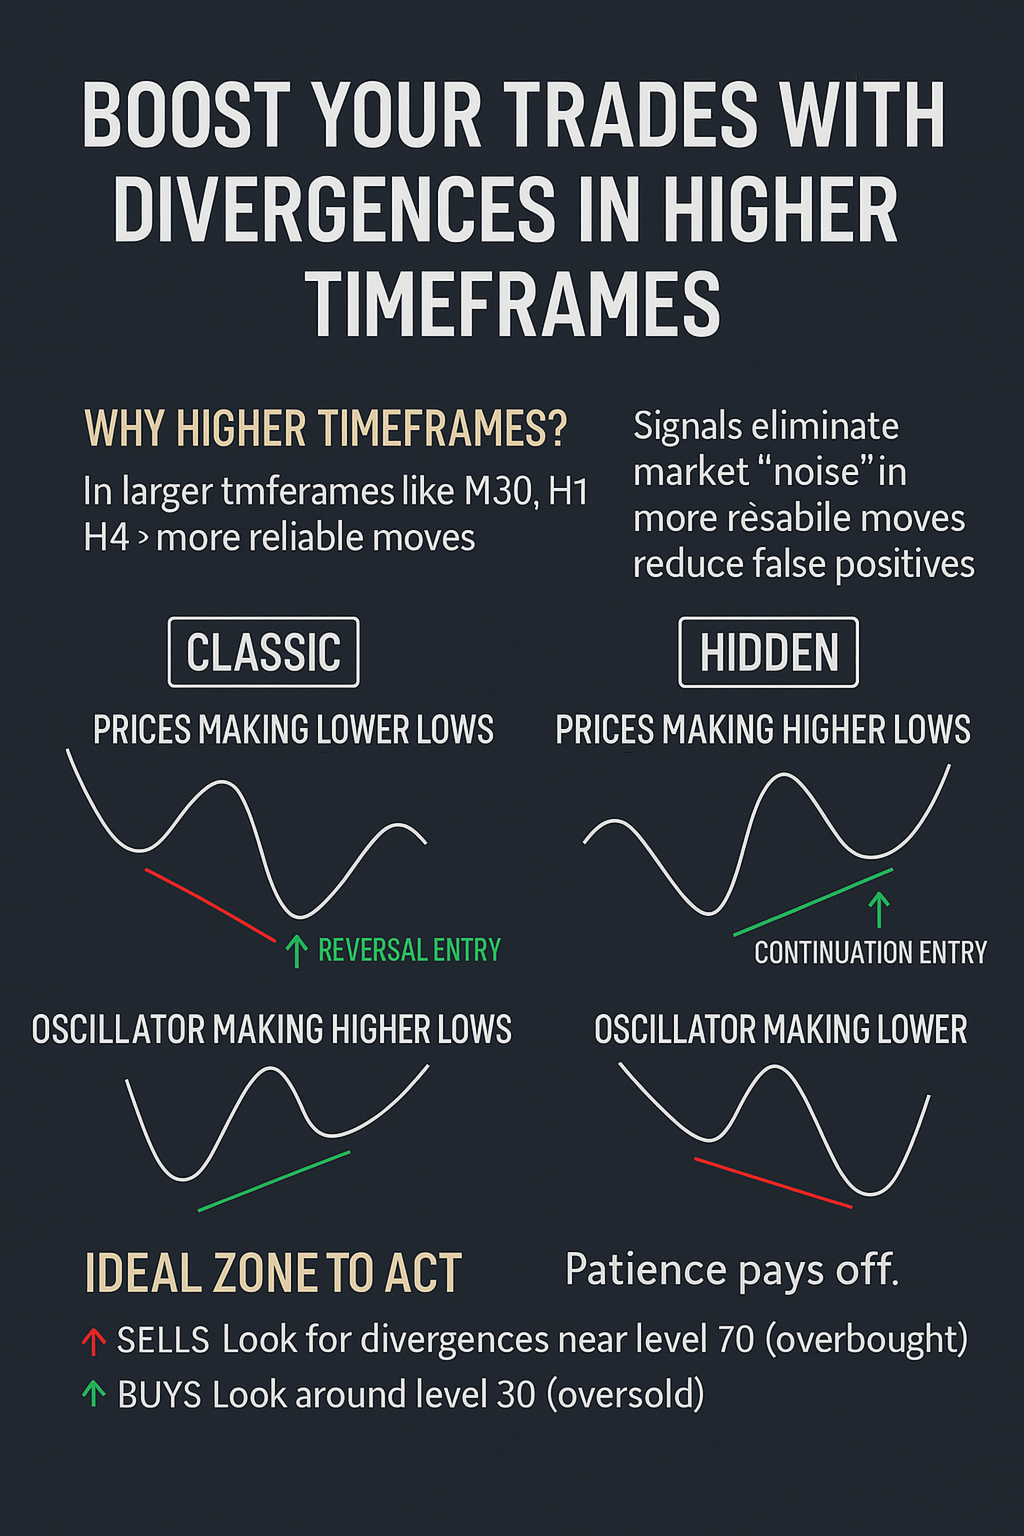
Divergences occur when price and the RSI indicator move in opposite directions, revealing hidden imbalances in market momentum. By detecting these divergences early, you can anticipate movements before they become visible in price action.

  • Classic Divergence → Signals weakening trends and potential reversals. Perfect for identifying tops or bottoms in the market.
  • Hidden Divergence → Confirms trend continuation after pullbacks. Ideal for entering trades aligned with the main trend.

Real-time divergence detection allows you to trade with higher confidence, enter markets at optimal points, and improve your risk/reward ratio.

⚡ Key Benefits

  • Automatic detection of classic and hidden divergences, no manual scanning required.
  • Visual cues on chart and RSI window – arrows, lines, and levels for immediate clarity.
  • Instant alerts to capture every trading opportunity.
  • Market noise filters to reduce false signals.
  • Works on any symbol and timeframe.
  • Fully customizable to fit your trading strategy.
  • Optimized code for reliability and speed (#property strict).

⚙ Customizable Settings

  • RSI period (adjust sensitivity).
  • Show trend lines on price chart (yes/no).
  • Show trend lines on RSI (yes/no).
  • Enable or disable alerts.
  • Choose divergence type: classic, hidden, or both.

🖥 Real-World Trading Examples

1. Trend Reversal (Classic Divergence): EUR/USD sets new highs, but RSI fails to confirm, forming lower highs. Easy RSI Divergences signals with a red arrow and connecting lines, alerting you to a potential reversal.

2. Trend Continuation (Hidden Divergence): GBP/USD in an uptrend pulls back, forming higher lows while RSI makes lower lows. The indicator displays a green arrow, signaling the trend is likely to continue.

💡 Pro Tips for Maximum Effectiveness

  • Combine with key levels analysis (support, resistance, volume).
  • Confirm signals with candlestick patterns or price action setups.
  • Adjust parameters and timeframes to match your trading style.
  • Validate signals on higher timeframes for stronger confirmation.

✅ Why Traders Choose Easy RSI Divergences

  • Minimized false signals through a highly optimized algorithm.
  • Alerts and visualization in a single, easy-to-use indicator.
  • Intuitive for beginners, precise for professionals.
  • Flexible and adaptable for any technical trading strategy.
  • Gain confidence and clarity in every trade.

📦 Compatibility

  • Platform: MetaTrader 4
  • Assets: Forex, indices, commodities, cryptocurrencies, metals
  • Timeframes: M1, M5, M15, M30, H1, H4, D1, W1, MN

Easy RSI Divergences isn’t just an indicator – it’s your personal trading assistant, helping you anticipate market moves with precision. Spot reversals, ride strong trends, and make smarter decisions with timely, actionable signals.

🚀 Turn market analysis into a competitive advantage and elevate your trading with Easy RSI Divergences today.

Produits recommandés
This product is a part of  ON Trade Waves Patterns Harmonic Elliot Wolfe you can test free version on EURJPY from this link  Wolf Waves Indicator Découvrez les Vagues de Loup - Votre Outil de Trading Ultime ! Êtes-vous à la recherche d'un outil puissant pour repérer facilement les Vagues de Loup sur n'importe quel intervalle de temps ? Ne cherchez plus ! Notre indicateur de Vagues de Loup fait le travail sans effort. Voici pourquoi il est parfait pour vous : Caractéristiques principales : Déte
Overview Harmonic Patterns MT4 is a technical analysis indicator designed for the MetaTrader 5 platform. It identifies and displays harmonic price patterns, such as Butterfly, Cypher, Crab, Bat, Shark, and Gartley, in both bullish and bearish directions. The indicator calculates key price levels, including entry, stop loss, and three take-profit levels, to assist traders in analyzing market movements. Visual elements and customizable alerts enhance usability on the chart. Features Detects six ha
All Symbols   AND  All Time frames Scan                                                                                                                 Document Introduction   The ABCD is a basic harmonic pattern. The ABCD pattern is a visual, geometric chart pattern comprised of three consecutive price swings. It looks like a diagonal lightning bolt and can indicate an upcoming trading opportu
Voenix
Lorentzos Roussos
4.58 (12)
Motifs harmoniques , scanner et commerçant  Patrons inclus : Modèle ABCD Motif Gartley Motif chauve-souris Modèle de chiffrement Modèle 3Drives Motif cygne noir Motif cygne blanc Motif Quasimodo ou motif Over Under Modèle de chauve-souris alternative Motif papillon Motif de crabe profond Motif crabe Motif requin Motif FiveO Motif tête et épaules Motif triangle ascendant Modèle un deux trois Et 8 motifs personnalisés Voenix est un scanner de modèles harmoniques multi-périodes et multi-paires, pr
Monster Harmonic Indicator
Paul Geirnaerdt
4.59 (29)
Monster Harmonics Indicator is a harmonic pattern indicator. It recognizes Gartley, Bat, Crab, Butterfly, Cypher, White Swan, Black Swan, Shark and several other patterns. Projected patterns that are not yet completed are recognized, too. Monster even shows the PRZ (Potential Reversal Zone). Users can add their own user defined patterns to Monster. Besides the current pattern, Monster also shows all patterns in the symbols history. Monster will provide alerts for developing patterns. Introduced
Reversal Pattern Pro
Boonyapagorn Rodvattanajinda
Reversal Patterns Pro Reversal Patterns Pro is a Price Action (PA) analytical tool that scans the reversal patterns.  - Finds and marks the most dependable Japanese candlestick patterns in real-time. - Supports all time frames (Best for Scalping) - Doesn't repaint making it an exceptional indicator for Expert Advisors. Input parameters : - Support & Resistance Mode ( true or false ) for enabling advanced filtering - Donchian Period - RSI Period - RSI Oversold Level - RSI Overbought Level - Al
Wolfe Wave Scanner MT4
Reza Aghajanpour
4.64 (11)
**  All Symbols  x  All Timeframes  scan just by pressing scanner button ** *** Contact me  to send you instruction and add you in "Wolfe Wave Scanner group" for sharing or seeing experiences with other users. Introduction: A Wolfe Wave is created with five-wave patterns in price. It shows supply and demand and a fight towards a balance price. T hese waves of price actions can help traders identify the boundaries of   the trend . Also  It helps forecast how the price will move in the near future
RTrends
Nikolay Likhovid
The RTrends indicator does two things: first, it automatically draws the layout of the price chart by plotting trend lines and, secondly, it produces bearish and bullish signals. The layout reflects the fractal nature of the market. Trends from different time horizons are applied simultaneously on the chart. Thus, from a single chart a trader can see trend lines of higher timeframes. The lines, depending on the horizon, differ in color and width: the older the horizon, the thicker the line is. T
BONUS INDICATOR HERE :  https://linktr.ee/ARFXTools Trading Flow Using Fibo Eminence Signal 1️⃣ Wait for the Fibonacci to Auto-Draw The system automatically detects swings (from high to low or vice versa) Once the Fibonacci levels appear, the indicator sends an alert notification “Fibonacci detected! Zone is ready.” 2️⃣ Check the Entry Zone Look at the ENTRY LINE (blue zone) This is the recommended SELL entry area (if the Fibonacci is drawn from top to bottom) Wait for the price to enter
Gold Bricks FX USES THE TREND WAVE INDICATOR AND IT CAN IDENTIFY THE BEGINNING AND THE END OF A NEW WAVE TREND MOVEMENT. AS AN OSCILLATOR, THE INDICATOR IDENTIFIES THE OVERBOUGHT AND OVERSOLD ZONES. IT WORKS GREAT TO CATCH THE SHORT TERM PRICE REVERSALS AND USES A MARTINGALE STRATEGY TO CLOSE ALL TRADES IN PROFIT. USE DEFAULT SETTINGS ON H1 OR HIGHER TIME FRAME ON ANY PAIR FOR MORE ACCURATE TRADES WHY THIS EA : Smart entries calculated by 4 great strategies The EA can be run on even a $300
KT Renko Patterns MT4
KEENBASE SOFTWARE SOLUTIONS
2.33 (3)
KT Renko Patterns analyse le graphique Renko brique par brique afin de détecter des figures techniques bien connues, fréquemment utilisées par les traders sur divers marchés financiers. Par rapport aux graphiques basés sur le temps, les Renko offrent une vue épurée, rendant les figures plus faciles à reconnaître et à exploiter. KT Renko Patterns comprend plusieurs figures Renko, dont la majorité sont expliquées en détail dans le livre “Profitable Trading with Renko Charts” de Prashant Shah. Un
The indicator detects and displays Shark harmonic pattern (see the screenshot). The pattern is plotted by the extreme values of the ZigZag indicator (included in the resources, no need to install). After detecting the pattern, the indicator notifies of that by a pop-up window, a mobile notification and an email. The indicator highlights the process of the pattern formation and not just the complete pattern. In the former case, it is displayed in the contour triangles. After the pattern is comple
The   Fibonacci Confluence Toolkit   is a technical analysis tool designed to help traders identify potential price reversal zones by combining key market signals and patterns. It highlights areas of interest where significant price action or reactions are anticipated, automatically applies Fibonacci retracement levels to outline potential pullback zones, and detects engulfing candle patterns. Its unique strength lies in its reliance solely on price patterns, eliminating the need for user-define
Based on MACD indicator waves with standard parameters Applies Fibonacci levels to the last two MACD waves, positive and negative respectively, if at the moment the MACD indicator runs out of negative Wave - the color is green, if at the moment the MACD indicator runs out of positive Wave - the color is red. The Wave termination criterion is two ticks with a different MACD sign. Applies trend lines on the last four MACD Waves. Works well with the expert Figures MACD   https://www.mql5.com/ru/mar
Unlock hidden profits: accurate divergence trading for all markets Tricky to find and scarce in frequency, divergences are one of the most reliable trading scenarios. This indicator finds and scans for regular and hidden divergences automatically using your favourite oscillator. [ Installation Guide | Update Guide | Troubleshooting | FAQ | All Products ] Easy to trade Finds regular and hidden divergences Supports many well known oscillators Implements trading signals based on breakouts Display
PZ Harmonacci Patterns
PZ TRADING SLU
3.17 (6)
Trade smarter, not harder: Empower your trading with Harmonacci Patterns This is arguably the most complete harmonic price formation auto-recognition indicator you can find for the MetaTrader Platform. It detects 19 different patterns, takes fibonacci projections as seriously as you do, displays the Potential Reversal Zone (PRZ) and finds suitable stop-loss and take-profit levels. [ Installation Guide | Update Guide | Troubleshooting | FAQ | All Products  ] It detects 19 different harmonic pric
Fibonacci retracements can be used to draw support lines, identify resistance levels, place stop-loss orders and set target prices. The Advanced Automatic Fibonacci retracements draws automatically all the levels. You have a lot of options to choose. For exemple you can use the tracements of another time frame (MTF) in the current chart, you can also choose between the closest level or less close to draw the retracements. You can also add 2 levels of your choice. You can add levels extensions o
Stochastic Divergen MT4
Komang Putra Riswanjaya
Overview The Stochastic Divergence Indicator is a tool designed to help identify potential market turning points by analyzing divergences between price and the Stochastic Oscillator. It highlights divergence signals visually on the chart, assisting traders in observing possible trend changes. Key Features No Repaint: Once a signal is formed, it remains on the chart. Adjustable Parameters: Settings can be modified to fit different trading preferences and timeframes. Visual Display: Arrows are pl
Tableau de Bord de Reversal Price Action Offre et Demande Le Price Action Demand & Supply Reversal Dashboard est un indicateur avancé de scan multi-actifs conçu pour identifier des opportunités de retournement à forte probabilité sur tous les instruments de votre liste de surveillance et les afficher dans un tableau de bord clair en temps réel. Il combine les concepts clés du Smart Money Concepts (SMC) et du Price Action afin de permettre aux traders d’identifier rapidement les meilleures config
OB Scanner
Suriya Thammalungka
OB Scanner Indicator — Overview OB Scanner is an enhanced Support & Resistance + Supply & Demand indicator designed to help traders identify where institutions and smart money are placing orders. It scans the chart for: 1. Order Blocks (Improved Demand & Supply Zones) Automatically detects Bullish Order Blocks (Demand) Automatically detects Bearish Order Blocks (Supply) Marks high-probability reversal zones Filters out weak OBs with volume and break-of-structure (BOS) confirmation 2. Buyer
Daily Candle Predictor est un indicateur qui prédit le cours de clôture d'une bougie. L'indicateur est principalement destiné à être utilisé sur les graphiques D1. Cet indicateur convient à la fois au trading forex traditionnel et au trading d'options binaires. L'indicateur peut être utilisé comme un système de trading autonome, ou il peut servir de complément à votre système de trading existant. Cet indicateur analyse la bougie actuelle, calcule certains facteurs de force à l'intérieur du corps
MACD Trend Break
Manoj Kumar Sharma
Oscillateur MACD avec filtrage de tendance avancé et indication d'alerte. Il détermine la tendance, les tendances faibles sont filtrées et la nouvelle force de la tendance est indiquée. L'oscillateur MACD fonctionne sur toutes les périodes et sur tous les symboles (devises, indices, pétrole, métaux, actions, options, graphiques renko hors ligne) 1. L'utilisateur peut modifier la valeur MACD, 2. Filtre de niveau MACD minimum, 3. Diviser la valeur filtrera le rapport de puissance avec lequel l'in
YK-Fibo Pivot Indicator: Trade Smarter with Fibonacci Pivot Points The YK-Fibo Pivot Indicator is a powerful technical analysis tool that combines the precision of Fibonacci retracements with the insights of Pivot Points. Whether you're a novice or seasoned trader, this indicator empowers you to spot profitable opportunities in the market with ease. Why Choose YK-Fibo Pivot? Pinpoint Support & Resistance: By calculating Fibonacci levels based on the previous day's high, low, and close prices, y
For this set of indicators 1. General information     - Calculates with high performance mathematical algorithms.     - Calculated from the price of candles     - The entry point of this order is filtered by the train EMA and the oscillator.     - Calculate the integrity of the candle 2. How does it work?     - You can see two types of order entry points: the notification on the monitor and the arrow.     - You can trust 75-95 percent of this entry point. 3. Settings     - Retracement is retr
MACDivergence MTF
Pavel Zamoshnikov
4.29 (7)
Advanced ideas of the popular MACD indicator: It detects and displays classic and reverse divergences (three methods of detecting divergences). It uses different color to highlight an uptrend and a downtrend. Two methods of determining a trend: а) MACD crosses the 0 level (classic signal); б) MACD crosses its own average (early signal). This is a multi-timeframe indicator: it can display MACD data from other timeframes. Two methods of drawing: classic histogram and line. It generates sound and v
GoldBreaker Pro MT4 is a fully automated Expert Advisor for XAUUSD (Gold) trading on the H1 timeframe. It uses a 24-bar high/low breakout strategy with automatic position sizing and multi-layer risk management. No martingale, no grid trading, no manual intervention required. Validated Backtest Performance Testing period: October 1, 2023 – October 1, 2025 (24 months) Initial deposit: $10,000 Modeling: Every Tick, 53.6 million ticks, 90% history quality Spread: 3 points (IC Markets) Net profit: 1,
The main function of the indicator is to draw the target lines (support and resistance lines). The lines are plotted according to a special fractal algorithm. The lines are calculated with consideration of the zero bar. A different, more complicated calculation algorithm is used on the zero bar, in contrast to the other bars. This allows reacting to the market situation in real time, but on the other hand, redrawing is possible on the zero bar. If necessary, the zero bar can be omitted from calc
PZ Support Resistance
PZ TRADING SLU
3.33 (3)
Unlock key market insights with automated support and resistance lines Tired of plotting support and resistance lines? This is a multi-timeframe indicator that detects and plots supports and resistance lines in the chart with the same precision as a human eye would. As price levels are tested over time and its importance increases, the lines become thicker and darker, making price leves easy to glance and evaluate. [ Installation Guide | Update Guide | Troubleshooting | FAQ | All Products ] Boos
Classic Fractals indicator for MT4, with additional Trendlines connecting the latest couples of fractals ( fractals are showing highest high, and lowest low on each period) Rules for trendlines: -if new top fractal is below the last one = new resistance line -if new bot fractal is above the last one = new support line -Trendlines can be hidden -Fractals can be hidden Fractal Period = can be both even or uneven number, as it is setting for half (one side) of the bars sequence for findin
Trade with Gann on your side!! MASTER CIRCLE 360 CIRCLE CHART, originally created by Gann admitted that this is “The Mother of all charts”. It is one of the last studies that this great trader left for us. The numeric tab le is apparently quite simple like all the tables and is based on square numbers, the SQUARE OF 12 and is by evolution, one of the most important square numbers. Here we can find CYCLE, PRICE AND TIME thanks to angles and grades, to show past and future support and resistance.
Les acheteurs de ce produit ont également acheté
Gann Made Easy
Oleg Rodin
4.83 (162)
Gann Made Easy est un système de trading Forex professionnel et facile à utiliser qui est basé sur les meilleurs principes de trading en utilisant la théorie de mr. WD Gann. L'indicateur fournit des signaux d'ACHAT et de VENTE précis, y compris les niveaux Stop Loss et Take Profit. Vous pouvez échanger même en déplacement en utilisant les notifications PUSH. VEUILLEZ ME CONTACTER APRÈS L'ACHAT POUR RECEVOIR GRATUITEMENT DES INSTRUCTIONS DE TRADING ET D'EXCELLENTS INDICATEURS SUPPLÉMENTAIRES! Vou
The Propfolio Master Suite is the ultimate all-in-one analytical workstation for professional traders. Combining the power of the Beat The Market Maker (BTMM) methodology, Smart Money Concepts (SND/Liquidity), and Advanced Volume Profile, this suite replaces multiple different indicators with one optimized engine. Monitor up to 14 pairs simultaneously from a single chart, instantly identify market cycles, and seamlessly map institutional footprints with the click of a button. The Command Center
Scalper Inside PRO
Alexey Minkov
4.74 (69)
Scalper Inside PRO Scalper Inside PRO is an intraday trend and scalping indicator for MetaTrader 4 that uses an exclusive algorithm to quickly detect market direction and key target levels. It automatically calculates entry, exit and multiple profit targets, and shows detailed performance statistics so you can see how different instruments and strategies performed. This helps you choose the most suitable trading instruments for the current market conditions. Additionally, you can easily integrat
M1 Sniper
Oleg Rodin
5 (23)
M1 SNIPER est un système d'indicateurs de trading facile à utiliser. Il s'agit d'un indicateur à flèche conçu pour l'unité de temps M1. Cet indicateur peut être utilisé seul pour le scalping sur l'unité de temps M1 ou intégré à votre système de trading existant. Bien que conçu spécifiquement pour le trading sur l'unité de temps M1, ce système peut également être utilisé avec d'autres unités de temps. Initialement, j'avais conçu cette méthode pour le trading du XAUUSD et du BTCUSD. Cependant, je
Auto Optimized Parabolic RSI : Moteur de Momentum 3D Avancé La plupart des indicateurs pour les particuliers échouent car ils s'appuient sur des paramètres statiques qui se brisent dès que la volatilité du marché change. L'Auto Optimized Parabolic RSI résout le problème de l'« obsolescence des indicateurs » en recalculant continuellement son propre avantage mathématique, apportant une adaptation quantitative de niveau institutionnel directement sur votre terminal MT5. L'Avantage Principal : Opti
Le système PRO Renko est un système de trading très précis spécialement conçu pour le trading de graphiques RENKO. Il s'agit d'un système universel qui peut être appliqué à divers instruments de négociation. Le système neutralise efficacement ce qu'on appelle le bruit du marché en vous donnant accès à des signaux d'inversion précis. L'indicateur est très facile à utiliser et n'a qu'un seul paramètre responsable de la génération du signal. Vous pouvez facilement adapter l'outil à n'importe que
NAM Order Blocks
NAM TECH GROUP, CORP.
3.67 (3)
MT4 Multi-timeframe Order Blocks detection indicator. Features - Fully customizable on chart control panel, provides complete interaction. - Hide and show control panel wherever you want. - Detect OBs on multiple timeframes. - Select OBs quantity to display. - Different OBs user interface. - Different filters on OBs. - OB proximity alert. - ADR High and Low lines. - Notification service (Screen alerts | Push notifications). Summary Order block is a market behavior that indicates order collection
Quants HL Break
Ferhat Mutlu
5 (2)
Calcul avancé effectué par l'action pure des prix pour trouver les cassures LH et HL. Cela vous donnera d'excellents points d'inversion sur le marché.Les signaux LH et HL peuvent également être utilisés pour les évasions de traingle. Une fois que la cassure se produit, cela indique un fort renversement.Beau filtre pour les moyennes mobiles.Je suggère fortement de l'utiliser avec des indicateurs de tendance. Peut être utilisé comme une confirmation supplémentaire pour le support et la résistanc
Dynamic Forex28 Navigator
Bernhard Schweigert
4.43 (7)
Dynamic Forex28 Navigator - L'outil de trading Forex de nouvelle génération. ACTUELLEMENT 49 % DE RÉDUCTION. Dynamic Forex28 Navigator est l'évolution de nos indicateurs populaires de longue date, combinant la puissance de trois en un : Advanced Currency Strength28 Indicator (695 avis) + Advanced Currency IMPULSE avec ALERT (520 avis) + CS28 Combo Signals (Bonus). Détails sur l'indicateur https://www.mql5.com/en/blogs/post/758844 Qu'offre l'indicateur de force de nouvelle génération ? Tout
RFI levels PRO
Roman Podpora
5 (1)
L'indicateur montre avec précision les points de retournement et les zones de retour des prix où le       Acteurs majeurs   . Vous repérez les nouvelles tendances et prenez des décisions avec une précision maximale, en gardant le contrôle de chaque transaction. VERSION MT5     -     Révèle son potentiel maximal lorsqu'il est combiné à l'indicateur   TREND LINES PRO Ce que l'indicateur montre : Structures et niveaux d'inversion avec activation au début d'une nouvelle tendance. Affichage des nive
Apollo SR Master est un indicateur de support/résistance doté de fonctionnalités spéciales qui simplifient et fiabilisent le trading basé sur les zones de support/résistance. Cet indicateur calcule ces zones en temps réel, sans aucun décalage, en détectant les sommets et les creux locaux des prix. Pour confirmer la nouvelle zone de support/résistance, il affiche un signal spécifique indiquant que cette zone peut être prise en compte et utilisée comme un véritable signal d'achat ou de vente. Dans
Si vous achetez cet indicateur, vous recevrez mon Gestionnaire de Trading Professionnel   + EA  GRATUITEMENT. Tout d'abord, il convient de souligner que ce système de trading est un indicateur non repeint, non redessiné et non retardé, ce qui le rend idéal pour le trading manuel et automatisé. Cours en ligne, manuel et téléchargement de préréglages. Le "Système de Trading Smart Trend MT5" est une solution de trading complète conçue pour les traders débutants et expérimentés. Il combine plus de
CRT Candle Range Theory HTF MT4.   Ultimate CRT Indicator: Advanced ICT Concepts and Malaysian SnR Trading System Discounted   Price   $50  !!     Secure your lifetime access   now   before it switches to   subscription-only ! Master the Market Maker's Footprints with the Most Advanced Candle Range Theory Indicator Unlock the true power of   Smart Money Concepts (SMC)   and trade precisely like the institutions with the   Ultimate CRT Indicator . Built exclusively for serious traders, this indic
ACTUELLEMENT 40% DE RÉDUCTION La meilleure solution pour tout débutant ou trader expert ! Cet indicateur est un outil de trading unique, de haute qualité et abordable car nous avons incorporé un certain nombre de caractéristiques exclusives et une nouvelle formule. Avec seulement UN graphique, vous pouvez lire la force de la devise pour 28 paires Forex ! Imaginez comment votre trading va s'améliorer parce que vous êtes capable de repérer le point de déclenchement exact d'une nouvelle tendance
Signal GoldRush Trend Arrow L'indicateur GoldRush Trend Arrow Signal fournit une analyse précise et en temps réel des tendances, spécialement conçue pour les scalpers à haute vitesse et à court terme sur la paire XAU/USD. Conçu spécialement pour les intervalles de temps d'une minute, cet outil affiche des flèches directionnelles indiquant clairement les points d'entrée, ce qui permet aux scalpers de naviguer en toute confiance dans des conditions de marché volatiles. L'indicateur se compose
Market Structure Patterns MT4
Samuel Manoel De Souza
5 (18)
Market Structure Patterns   est un indicateur basé sur les   Smart Money Concepts   qui affiche les   éléments SMC/ICT   pouvant améliorer vos décisions de trading. Profitez des   alertes ,   notifications push   et   emails   pour être informé lorsqu’un élément se forme sur le graphique, que le prix franchit un niveau et/ou entre dans une zone. Les développeurs peuvent accéder aux valeurs des éléments de l’indicateur via les   variables globales , permettant l’automatisation des décisions de tr
Advanced Supply Demand
Bernhard Schweigert
4.91 (300)
Offre spéciale : 40 % de réduction La solution idéale pour les traders débutants comme experts ! Cet indicateur est un outil de trading unique, performant et abordable grâce à l’intégration de nombreuses fonctionnalités exclusives et d’une nouvelle formule. Cette mise à jour vous permet d’afficher des zones sur deux unités de temps. Vous pourrez ainsi visualiser non seulement une unité de temps supérieure, mais aussi l’unité de temps du graphique, ainsi que l’unité de temps supérieure : des z
Identify key turning points with reliable fractal analysis This indicator examines the price structure of fractals of different periods to determine possible reversal points in the market, providing timing to positional traders that already have a fundamental or technical valuation model. Unlike its younger brother, Reversal Fractals , this indicator won't miss reversals because of the period selected, and will find reversal fractals on a zig-zag fashion, ignoring those reversals which do not
L'indicateur « Dynamic Scalper System » est conçu pour la méthode de scalping, permettant de trader au sein des vagues de tendance. Testé sur les principales paires de devises et l'or, il est compatible avec d'autres instruments de trading. Fournit des signaux pour l'ouverture de positions à court terme le long de la tendance, avec un support supplémentaire pour les fluctuations de prix. Principe de l'indicateur : De grandes flèches déterminent la direction de la tendance. Un algorithme de gén
Si vous tradez sur le marché du Forex, disposer d'informations détaillées sur la force des devises et la corrélation entre les paires de devises peut élever votre trading à un niveau supérieur. La corrélation vous aidera à réduire votre risque de moitié, tandis que l'analyse de la force maximisera vos profits. Cet indicateur propose une approche hybride pour sélectionner les paires de devises les plus appropriées en combinant l'analyse de la force des devises et la corrélation des paires. Comme
ACTUELLEMENT 26% DE RÉDUCTION ! !! Cet indicateur est une super combinaison de nos deux indicateurs principaux ( Advanced Currency Strength 28   &  Advanced Currency IMPULSE with ALERT ). Il montre les valeurs de force de la devise pour les TICK-UNITS et les signaux d'alerte pour 28 paires Forex. 11 unités de tic-tac différentes peuvent être utilisées. Ce sont 1, 2, 3, 4, 5, 6, 10, 12, 15, 20 et 30 secondes. La barre de Tick-Unit dans la sous-fenêtre sera affichée et déplacée vers la gauche lo
Day Trader Master est un système de trading complet pour les day traders. Le système se compose de deux indicateurs. Un indicateur est un signal fléché pour acheter et vendre. C'est l'indicateur de flèche que vous obtenez. Je vous fournirai le deuxième indicateur gratuitement. Le deuxième indicateur est un indicateur de tendance spécialement conçu pour être utilisé conjointement avec ces flèches. LES INDICATEURS NE RÉPÉTENT PAS ET NE TARDENT PAS! L'utilisation de ce système est très simple. Il v
KURAMA GOLD SIGNAL PRO (MT4) — Système de Trading XAUUSD Complet avec Filtre à 7 Couches, TP/SL Automatique et Notation de Qualité PAS DE REPAINT. PAS DE REDESSIN. PAS DE RETARD. Chaque signal est permanent. Ce que vous voyez est ce que vous obtenez. BONUS : Achetez la licence à vie et recevez AI Zone Radar (valeur $59) + manuel PDF complet GRATUIT. Envoyez-moi un message après l'achat. AI Zone Radar : https://www.mql5.com/en/market/product/175834 CONFIANCE DES TRADERS : Déjà utilisé par une
Master head and shoulders patterns for better trading decisions A head and shoulders pattern is a chart formation that resembles a baseline with three peaks, the outside two are close in height and the middle is highest. It predicts a bullish-to-bearish trend reversal and is believed to be one of the most reliable trend reversal patterns. It is one of several top patterns that signal, with varying degrees of accuracy, that a trend is nearing its end. [ Installation Guide | Update Guide | Trouble
PZ Double Top Bottom
PZ TRADING SLU
5 (1)
Trade double tops and bottoms effectively The PZ Double Top/Bottom Indicator is a technical analysis tool that helps traders identify potential price reversal patterns in the market. These patterns, known as double tops and bottoms, are characterized by two consecutive peaks or valleys in the price of an asset. Double tops and bottoms are often seen as potential reversal patterns because they can signal a change in the direction of the current trend. [ Installation Guide | Update Guide | Troubl
Gold Scalper Super
Aleksandr Makarov
5 (2)
Gold Scalper Super is an easy-to-use trading system. The indicator can be used as a standalone scalping system on the M1 time frame, as well as part of your existing trading system. Bonus: when purchasing an indicator, Trend Arrow Super is provided free of charge, write to us after purchase. The indicator 100% does not repaint!!! If a signal appears, it does not disappear! Unlike indicators with redrawing, which lead to the loss of a deposit, because they can show a signal and then remove it.
Un indicateur technique qui structure les graphiques et identifie les mouvements de prix cycliques. Peut fonctionner sur n'importe quel graphique. Plusieurs types de notifications. Il y a des flèches supplémentaires sur le graphique lui-même. Sans revenir sur l'histoire, fonctionne sur la fermeture de la bougie. TF recommandé à partir de M5 et plus. Facile à utiliser et à configurer les paramètres. Lorsque vous utilisez 2 indicateurs avec des paramètres différents, vous pouvez les utiliser sans
KuKl
IGOR KIRIANEN
The indicator is built on a non-standard Zig Zag, it draws accumulations after which if the price leaves this zone and a test of this zone occurs, then a sound signal is given and an arrow appears - after the test candle closes.The indicator does not redraw its signals, it is very easy to use, there are only three settings 1- this is the zig zag parameter 2- this is the minimum price exit from the zone 3- this is the maximum price exit from the zone. The lower the parameter for Zig Zag, the more
Trend Screener
STE S.S.COMPANY
4.79 (95)
Indicateur de tendance, solution unique révolutionnaire pour le trading et le filtrage des tendances avec toutes les fonctionnalités de tendance importantes intégrées dans un seul outil ! Il s'agit d'un indicateur multi-période et multi-devises 100 % non repeint qui peut être utilisé sur tous les symboles/instruments : forex, matières premières, crypto-monnaies, indices et actions. OFFRE À DURÉE LIMITÉE : L'indicateur Support and Resistance Screener est disponible pour seulement 65 $ et à vie. (
Advanced UT BOT ALERTS for MT4 Système professionnel de détection de tendance multi-filtres | Version améliorée du moteur UT BOT Nous proposons uniquement des indicateurs de haute qualité. Advanced UT BOT est conçu pour un usage professionnel, avec une logique de signal stable et un calcul sécurisé qui évite tout retard ou mise à jour erronée. Il ne redessine, ne supprime ni ne modifie aucun signal passé. Tous les signaux BUY et SELL sont générés uniquement après la clôture de la bougie , garant
Plus de l'auteur
SignalFusion 5
Carlos Mendez Sanchez
SignalFusion 5 Total market view in one chart. Monitor multiple pairs in real time, convert data into clear decisions, and spot opportunities for scalping, day trading, and swing. Works with majors like EUR/USD and GBP/USD and also exotics. Adds immediate value to any trader’s toolkit. 5 integrated indicators. Combines five signals into a single optimized list and runs by default with 9 pairs . Switching symbols is direct from parameters. After purchase, download for MT4/MT5 and use instan
FREE
Quantumcross
Carlos Mendez Sanchez
QuantumCross – The EA You’ve Been Looking For! Recommended currncy pairs: AUDCAD, AUDNZD, NZDCAD Ideal timeframe: M15 ️ Recommended Risk & Leverage Settings To ensure smooth operation and avoid free margin issues, please consider the following recommendations: Leverage 1:100 → Safe to use up to significant risk even on accounts starting from $1000 . Leverage 1:500  → $500 Our EA automatically defaults to low-risk mode for maximum safety, but you always have the flexibility to adjust risk pa
SmartStep FX
Carlos Mendez Sanchez
SmartStep FX – The New Generation of Grid Trading Are you looking for a solid, fully automated Expert Advisor ready to generate consistent profits in Forex? SmartStep FX is designed for traders who want real results with a proven strategy. What makes SmartStep FX unique? SmartStep FX comes with optimized parameters – no need to change anything. Optimized for AUDCAD on M5 – a stable pair with relatively low volatility. Dynamic grid management – customizable entry levels in pips to adap
Galigold
Carlos Mendez Sanchez
Important to downlad the set:   https://www.mql5.com/es/market/product/148482/comments?source=Site GaliGold — Master the U.S. Open Core idea Leverage Wall Street’s initial momentum in gold (XAUUSD) with disciplined execution. Key benefits ️ Peak-liquidity timing Breakout entries from the prior range Trend-following exit management Optional position scaling for faster recovery ️ Safeguards against adverse conditions ️ Workflow Watch the pre-open and define the key ran
BasketCloser
Carlos Mendez Sanchez
BasketCloser — Intelligent basket close by profit or loss Take control of outcomes: set a money target to close all positions when the basket reaches that profit, and a global loss cap to stop bad streaks early. Works per symbol or across the whole account, with an option to include pending orders. A clean on-chart panel shows orders, total lots, and aggregated P/L in real time. Does not open trades. It only manages exits: fast and consistent. Why choose it Consistent results: clo
Close Button FX
Carlos Mendez Sanchez
Close Button Panel — Instant Trade Control, Maximum Precision Overview: Close Button Panel is a high-speed trade management tool for MetaTrader 4, built for traders who demand total control and instant execution . Forget the “Trade” tab — manage all your positions directly from the chart with a single click through a clean, modern floating panel. Why Traders Choose It: One-Click Execution: Instantly close all , profitable , losing , or Buy/Sell-specific trades. Smart Filters: Limit actions
Filtrer:
Nicopaz
20
Nicopaz 2025.09.25 21:29 
 

L'utilisateur n'a laissé aucun commentaire sur la note

Répondre à l'avis