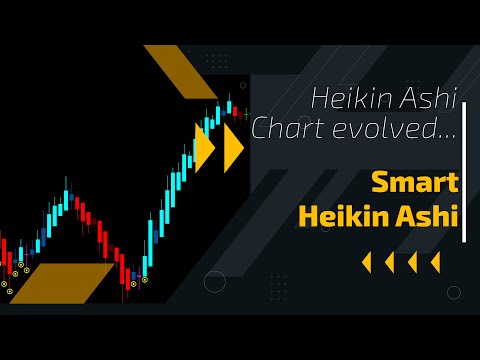
Smart Heikin Ashi
- Indicateurs
-
Flavio Javier Jarabeck
 We are a closed brotherhood of traders whose ultimate goal is to profit through well-studied, structured, and automated trades. As a result, we publish dozens of MT5 indicators (FREE and paid) to the global MQL5 community. 80% of our published products are high-quality free indicators so beginner
 - Version: 1.0
- Activations: 20
WHY SHOULD I CARE about the Smart Heikin Ashi?
The Smart Heikin Ashi is an innovative tool that enhances your ability to detect significant movements, dojis, and high-volume areas on the Heikin Ashi chart. Delve into a myriad of adjustable parameters in the settings section to tailor the tool to your trading strategy.
HOW DOES THE Smart Heikin Ashi WORK?
The Smart Heikin Ashi enhances your charting tools by highlighting strong movements and potential reversal points through its doji indicators. It incorporates an on-chart High Volume alert to highlight significant trading volumes and offers customizable parameters to define what constitutes a Doji. Enable alerts for various patterns and movements to stay ahead in your trading game.
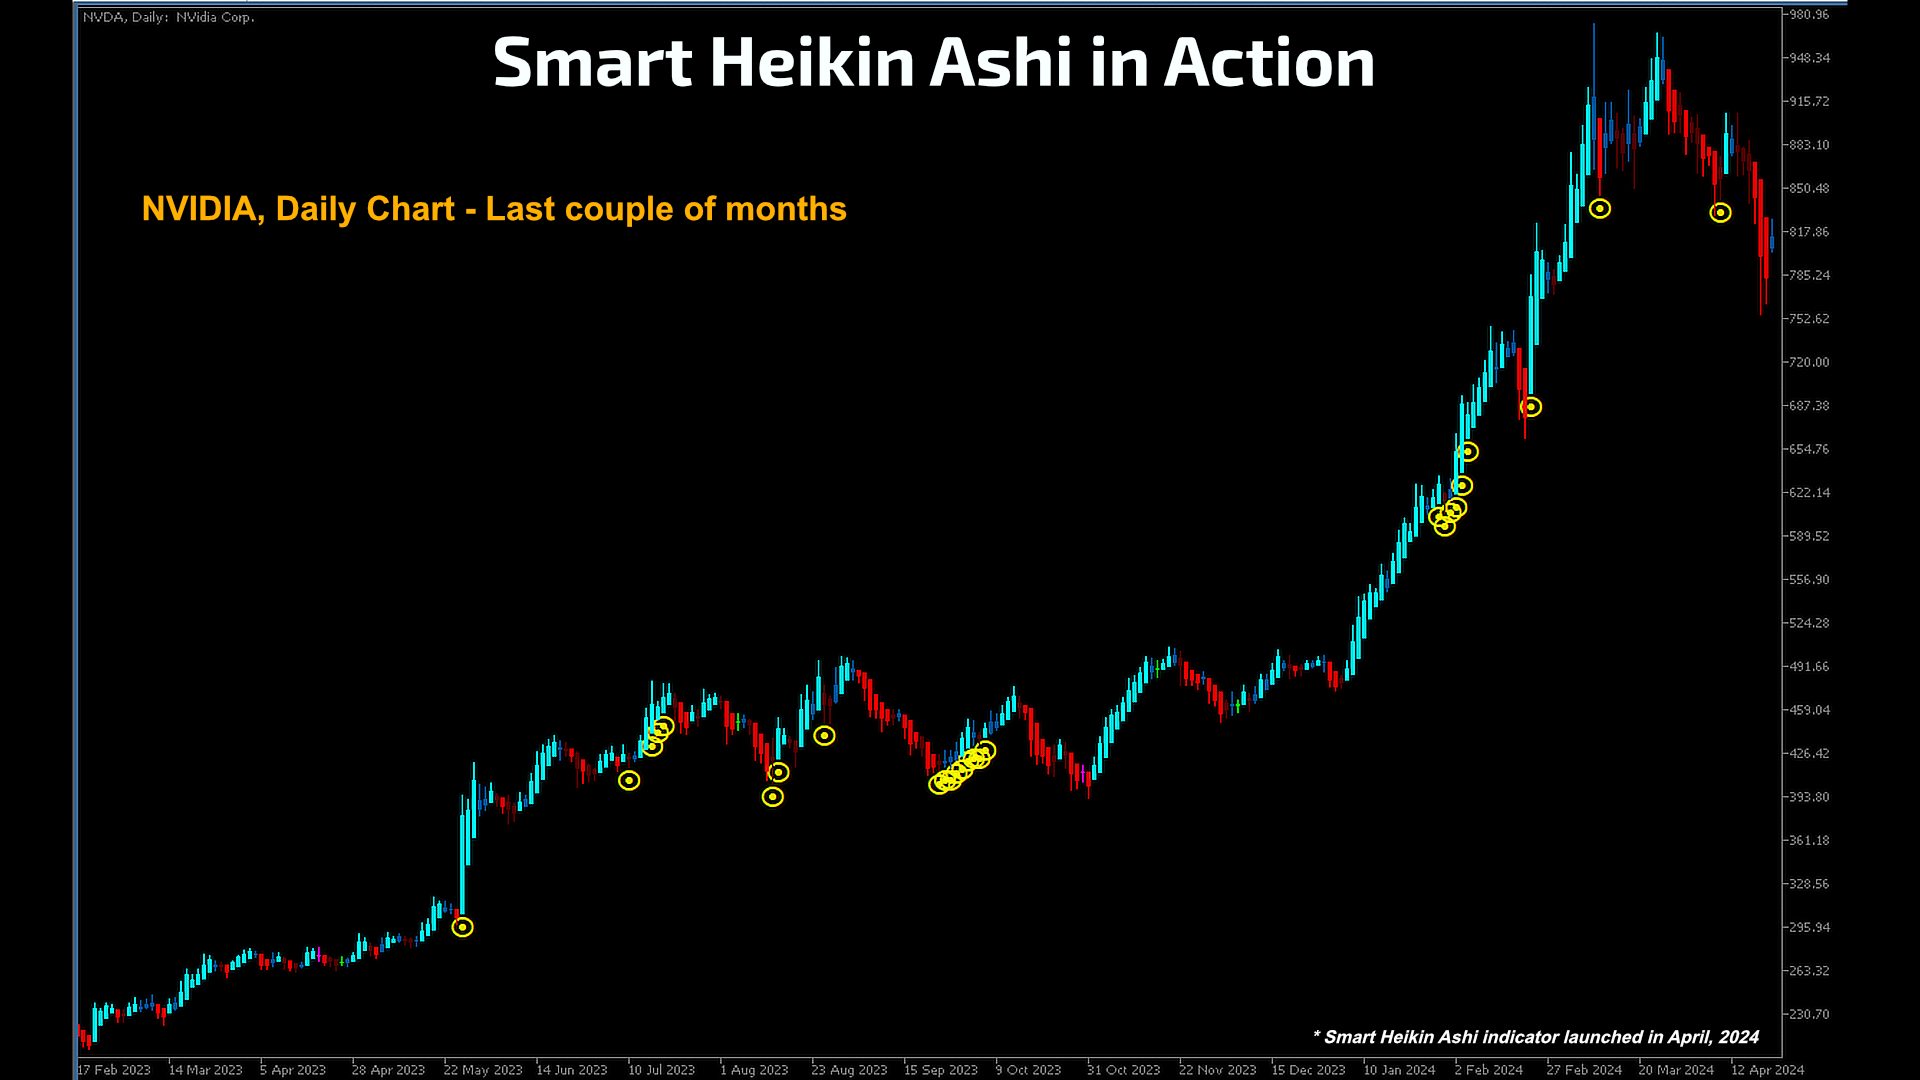
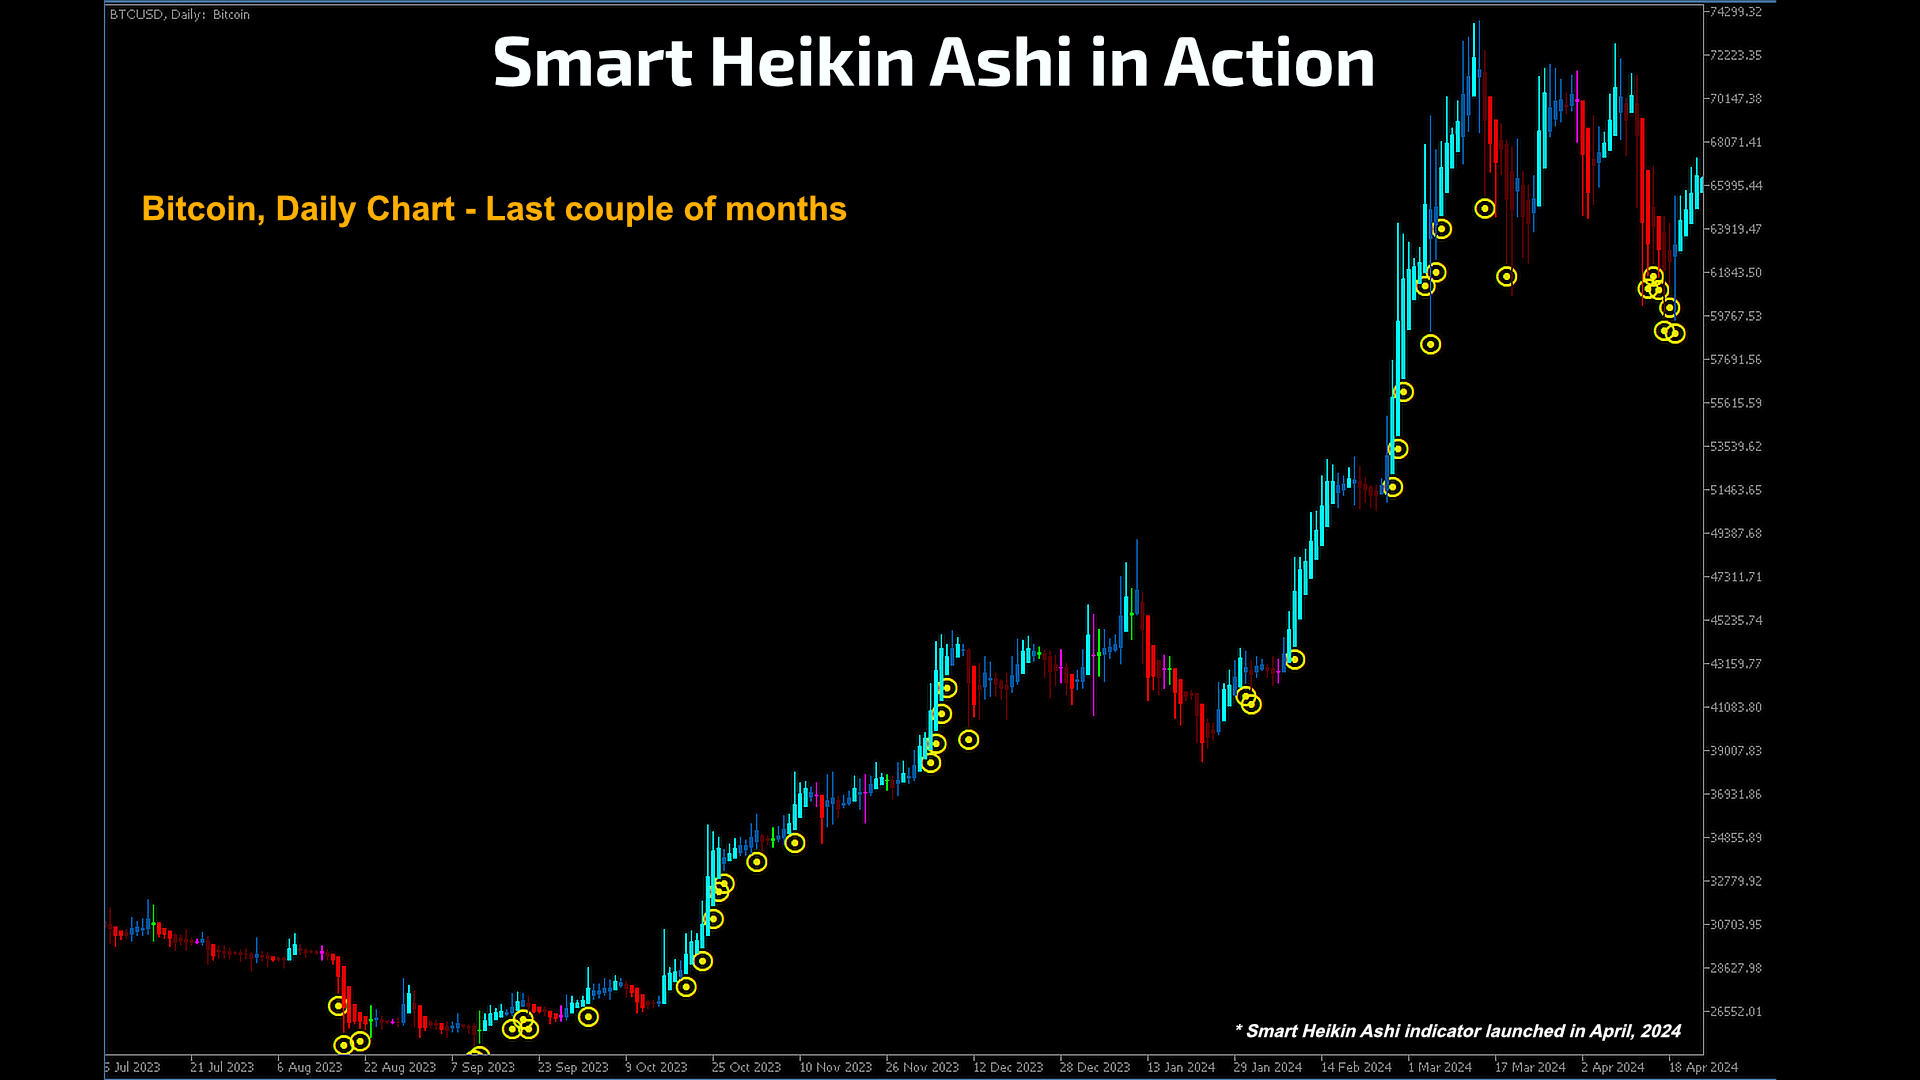
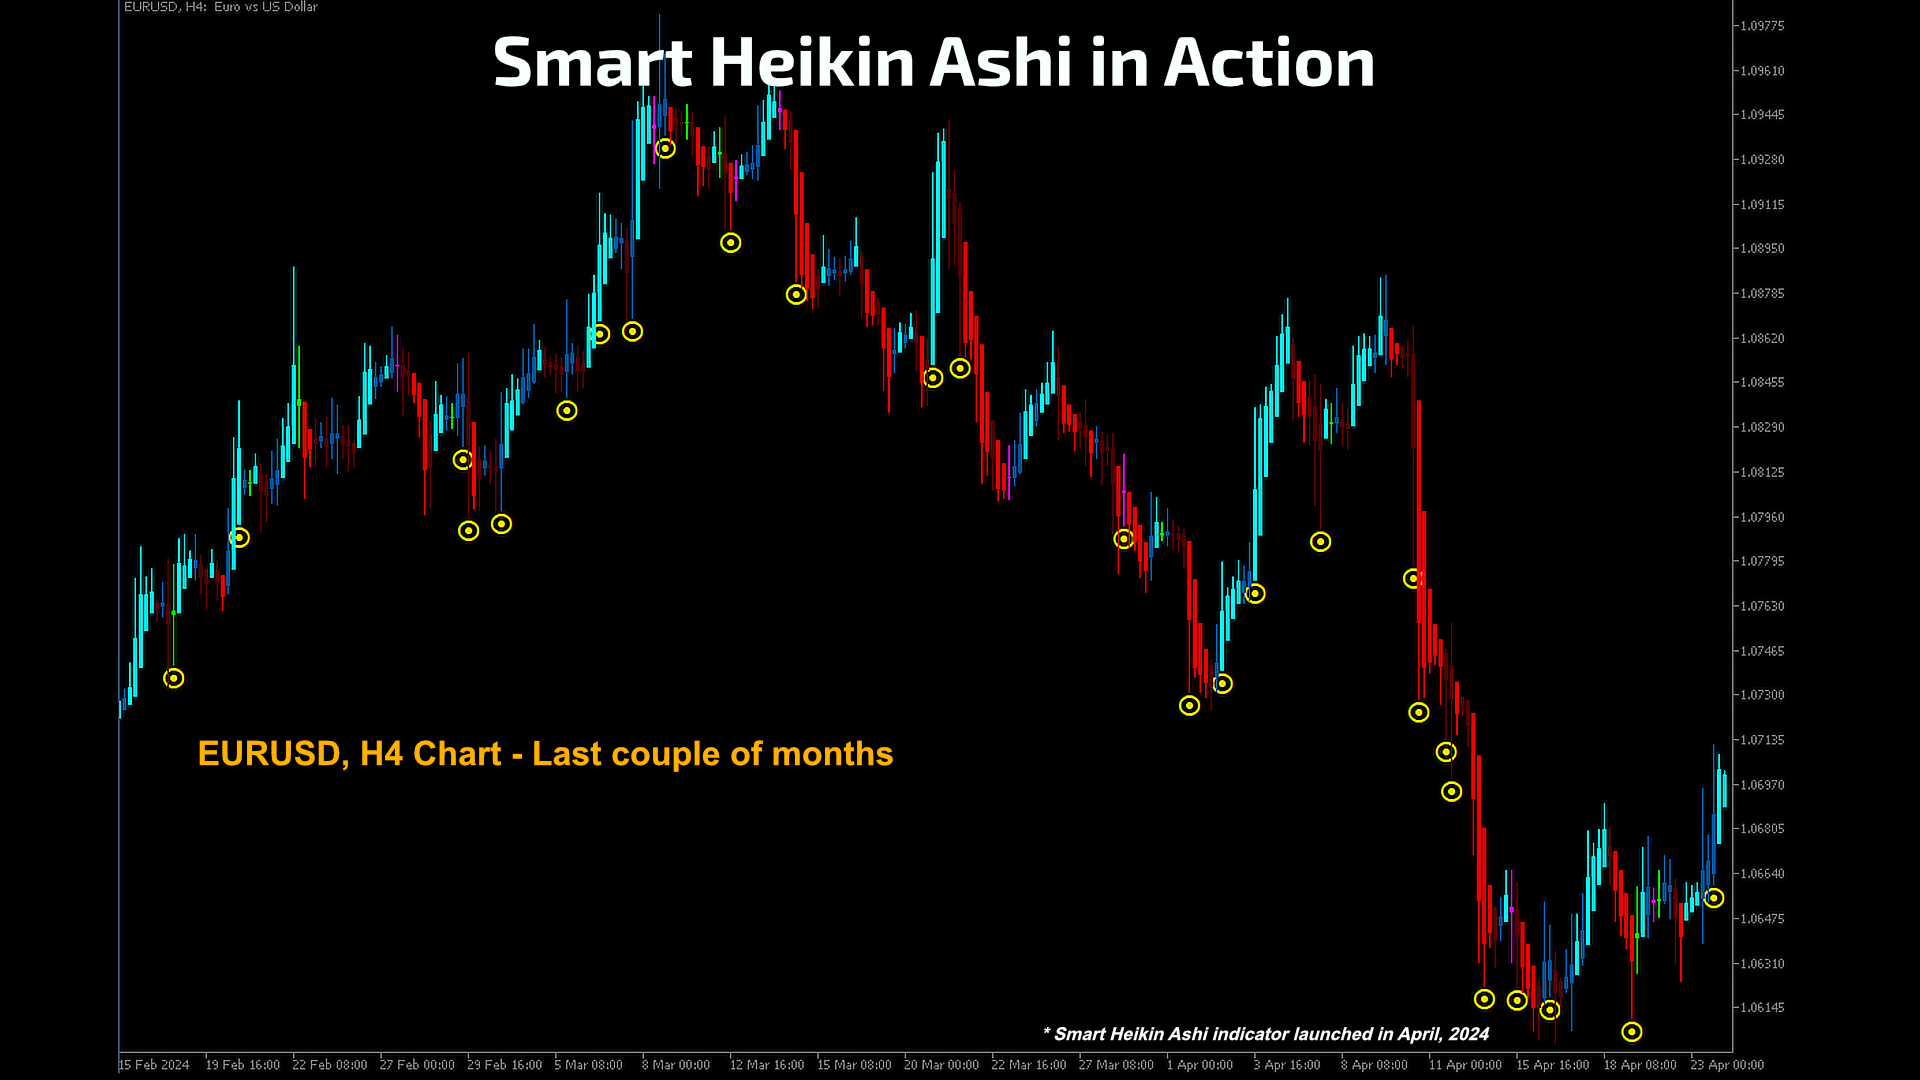
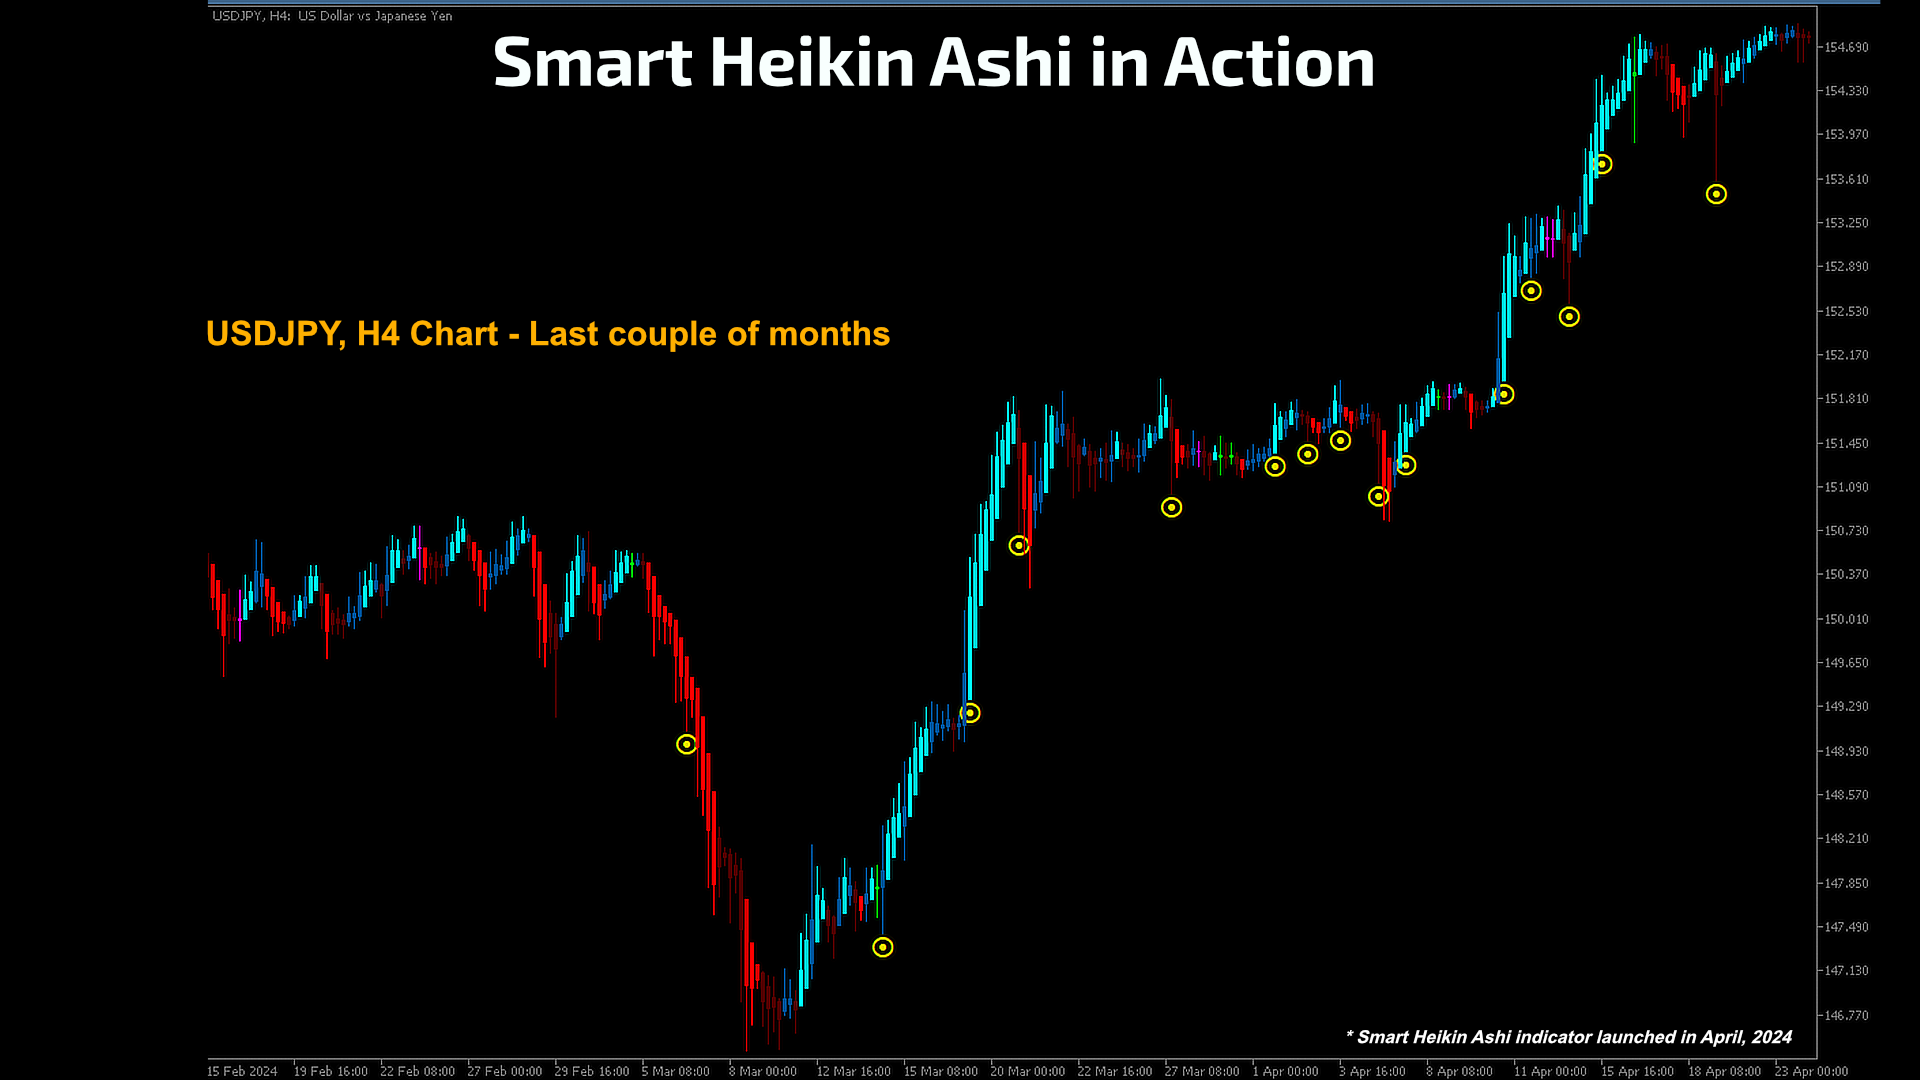
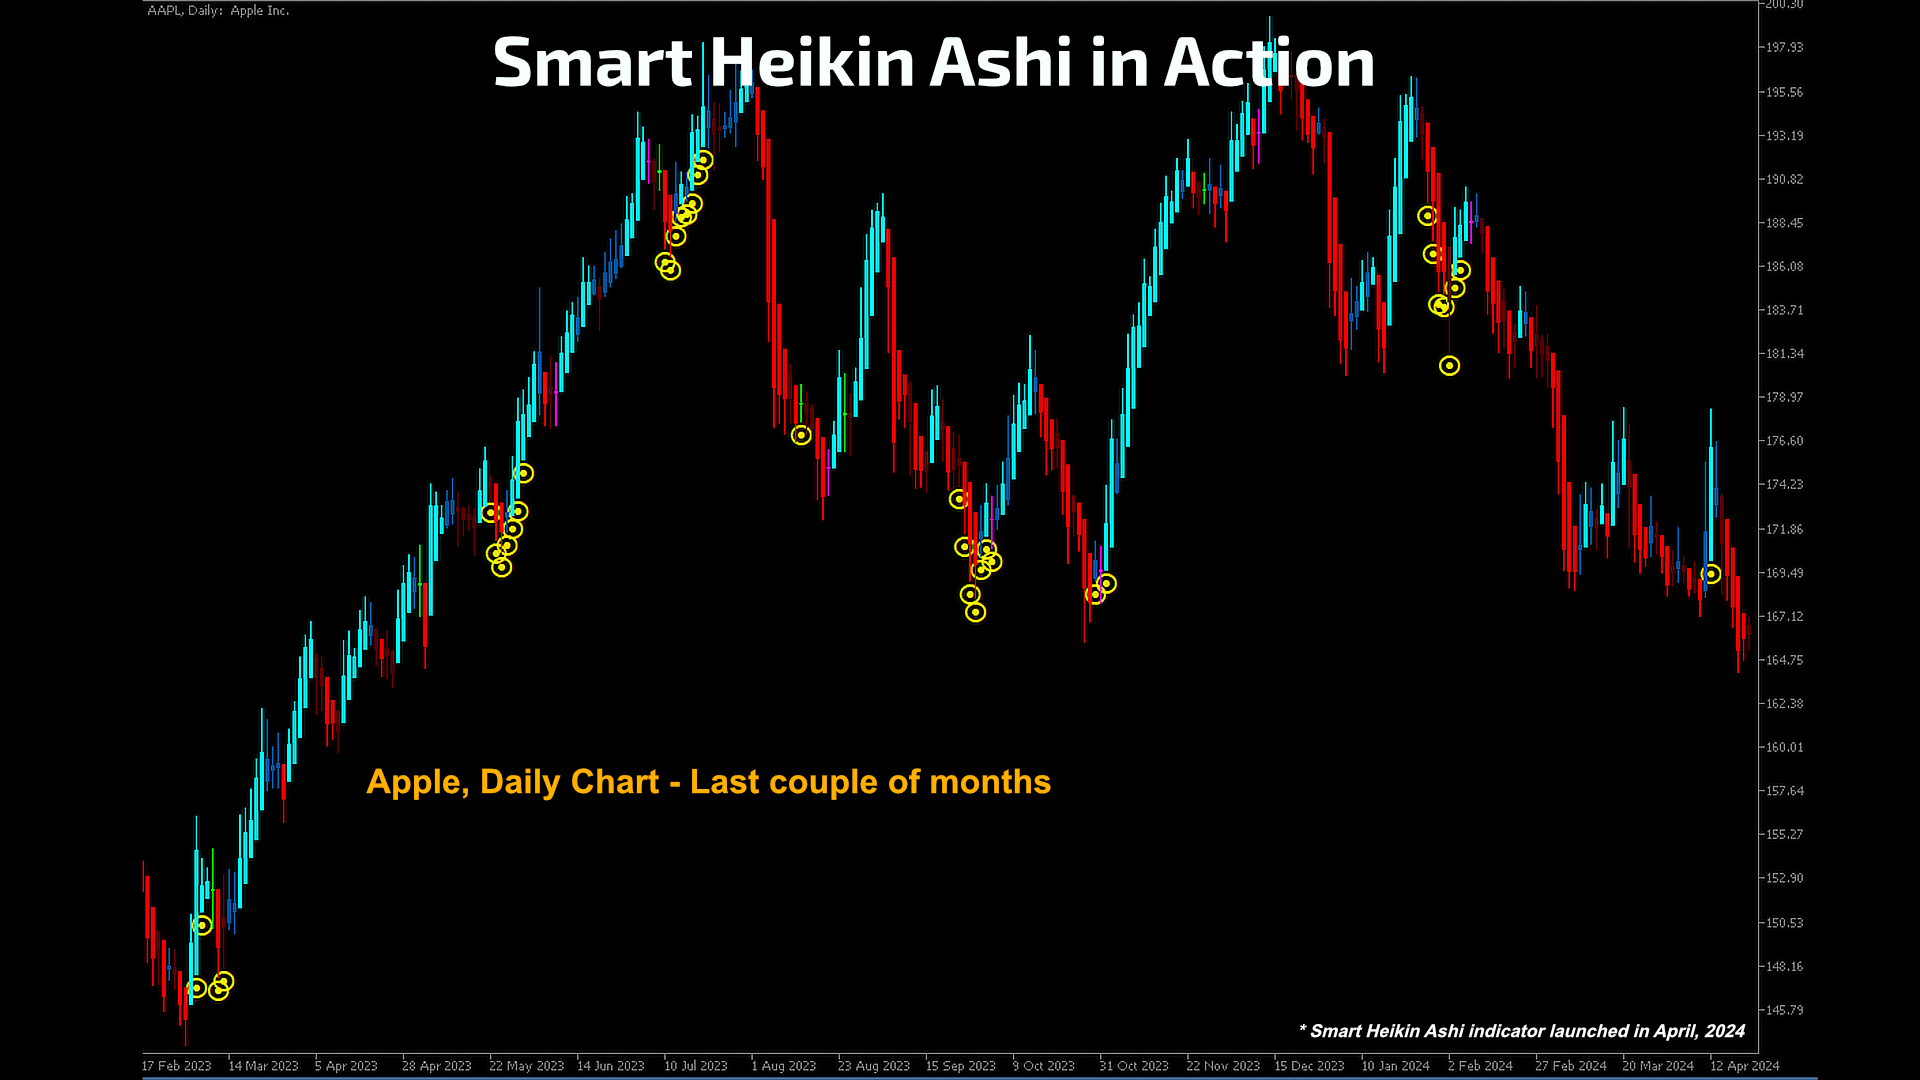
HOW TO "READ" the Smart Heikin Ashi
- Identify trend changes, consolidation phases, and strong movements with a multi-colored layer on your chart.
- Notice candles with unusually high volumes that might signify important market events.
- Think of it as your enhanced Heikin Ashi chart, supercharged for more insightful trading.
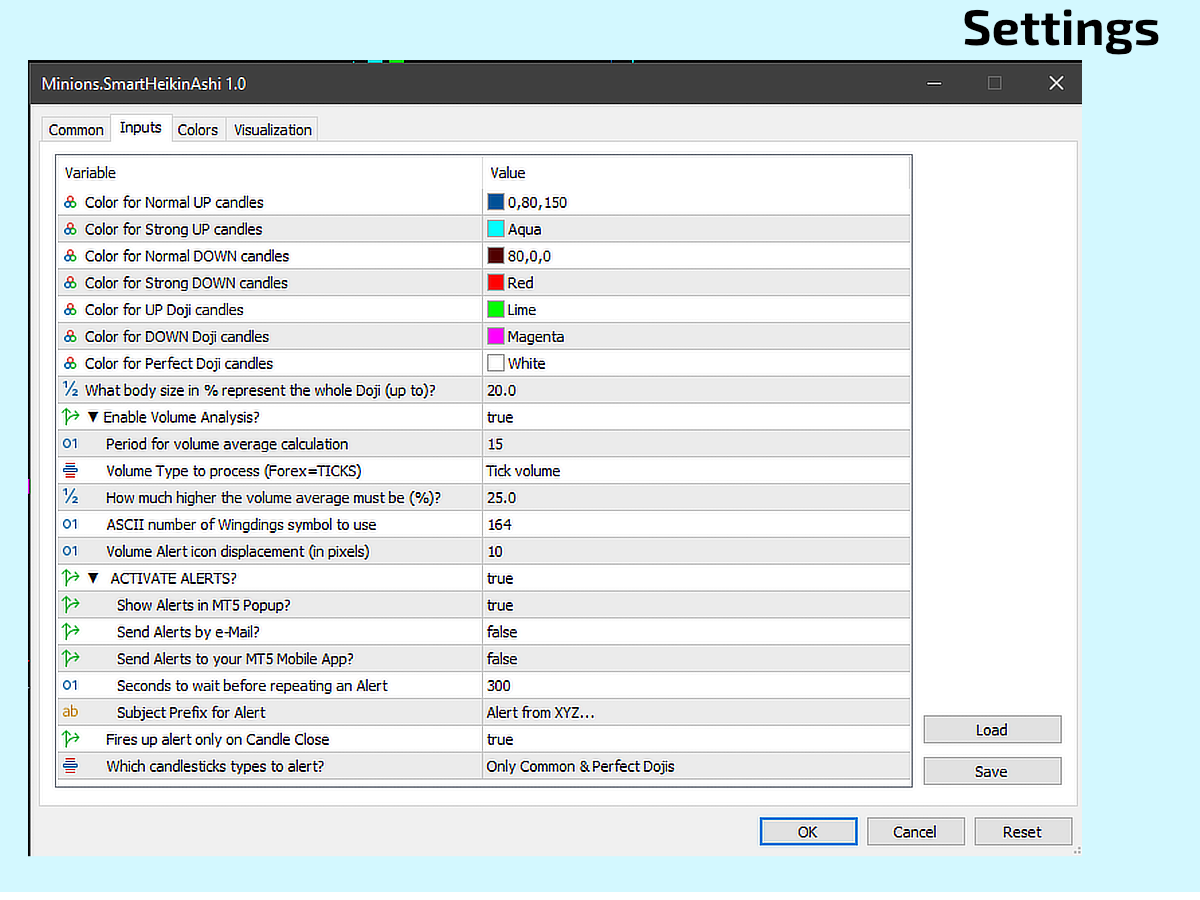
SETTINGS
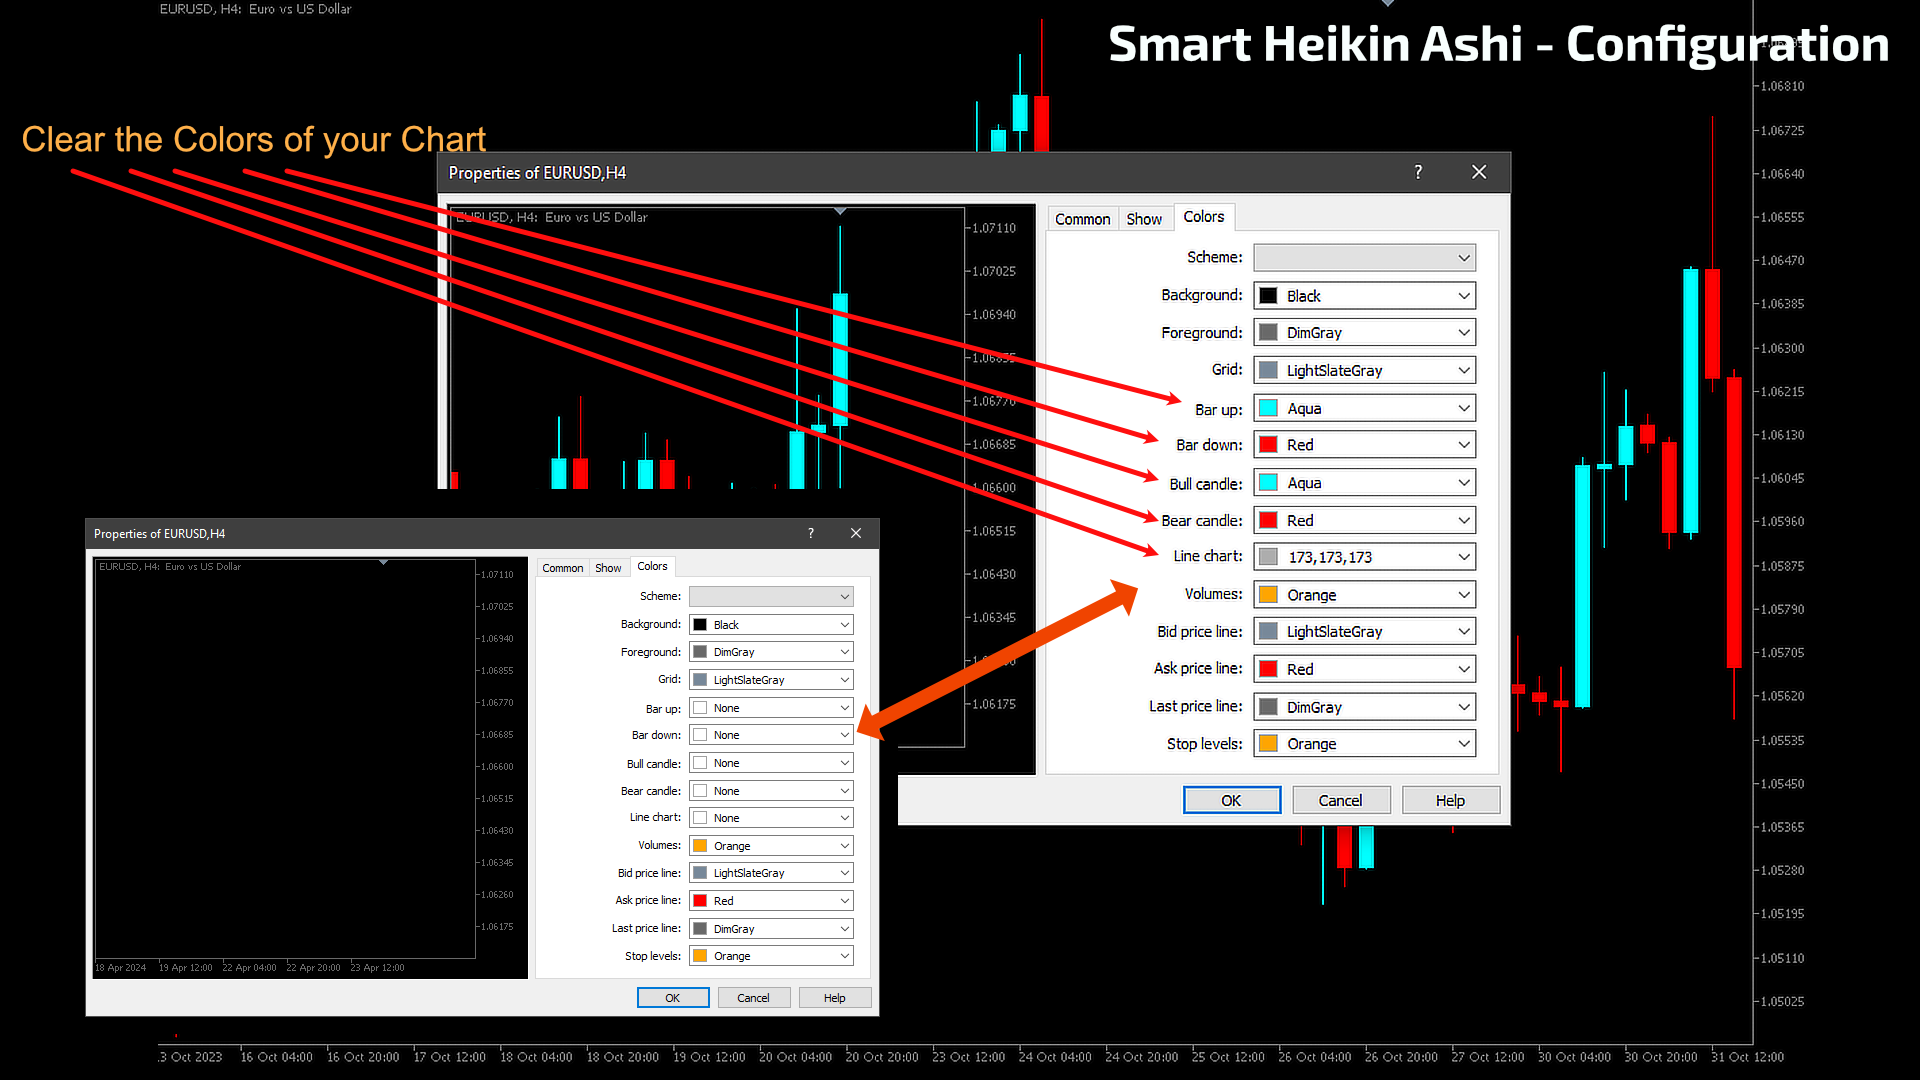
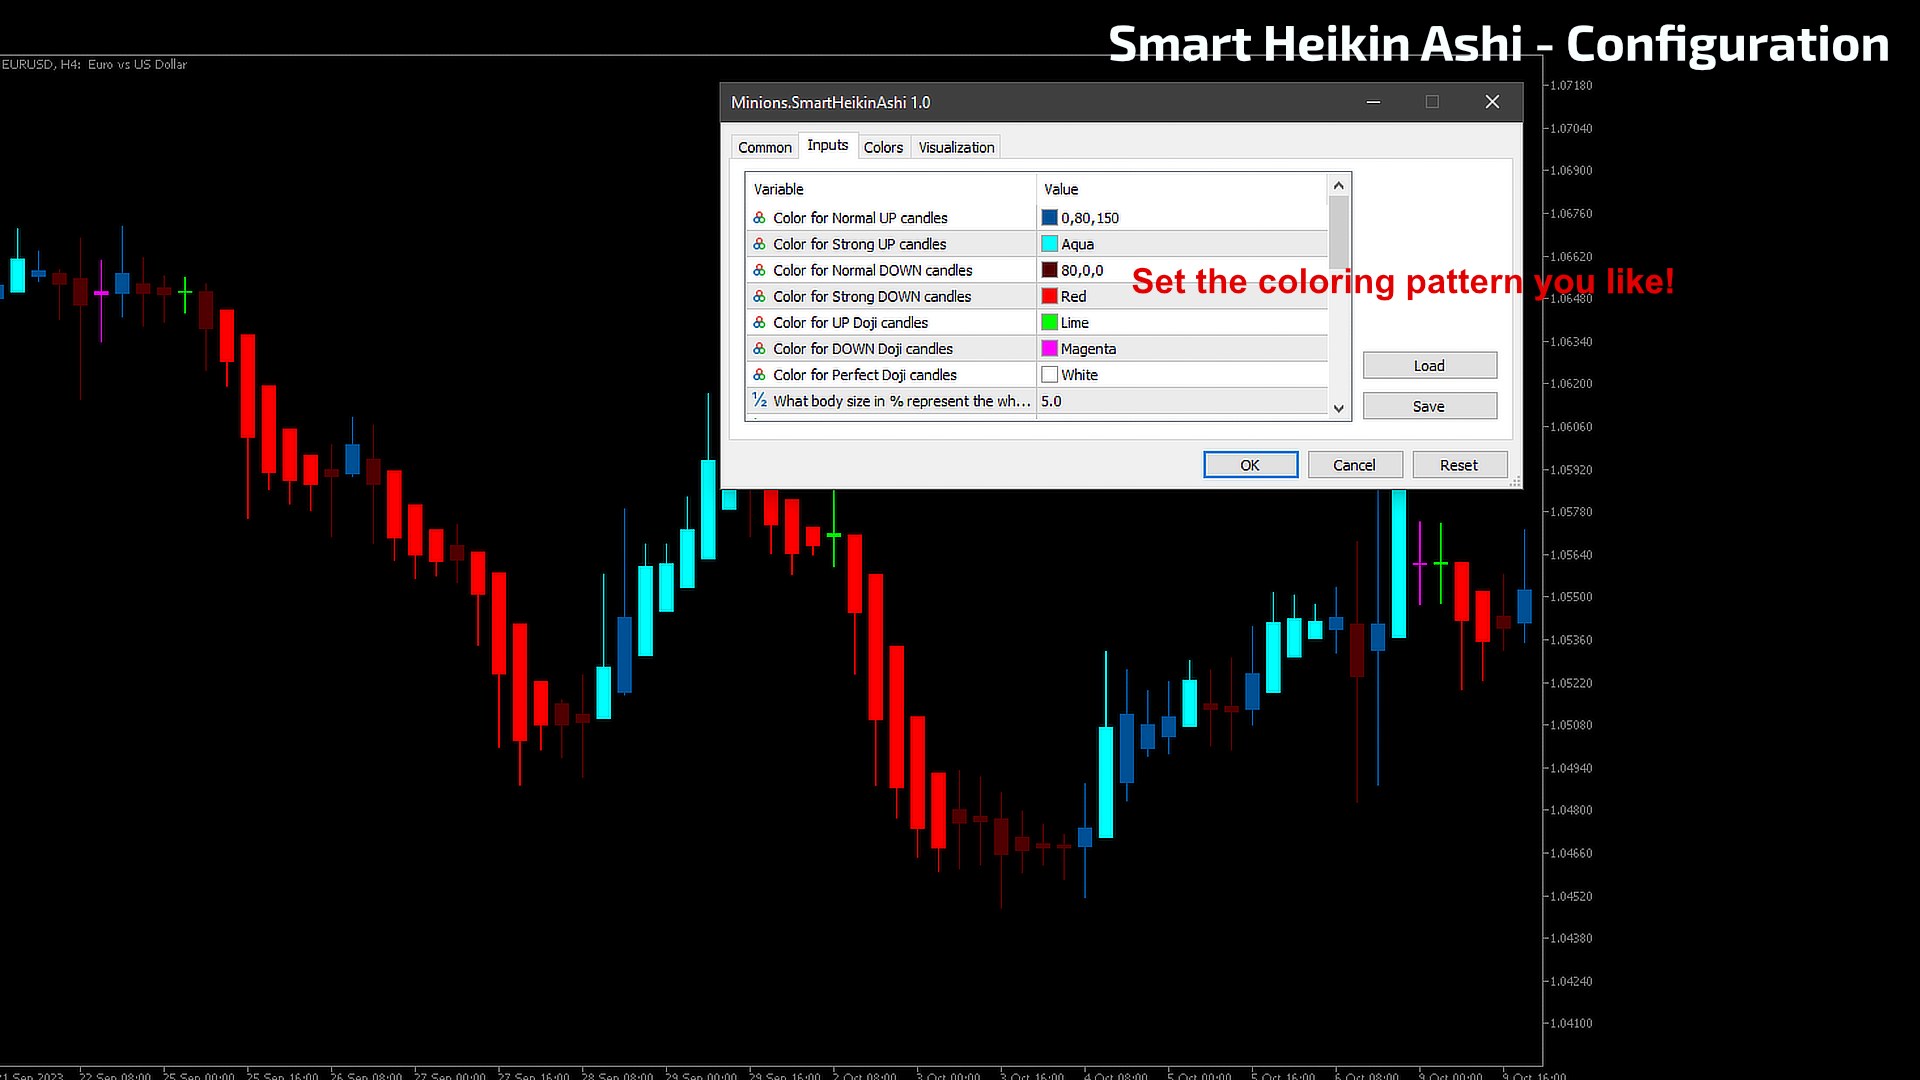
- --- COLORING SYSTEM ---
- Color for Normal UP candles: Customize the color to represent upward-moving normal candles.
- Color for Strong UP candles: Set a distinct color for candles that show strong upward movements.
- Color for Normal DOWN candles: Choose a color for downward-moving normal candles.
- Color for Strong DOWN candles: Highlight strong downward movements with a specific color.
- Color for UP Doji candles: Assign a color to upward Doji candles indicating indecision or reversal.
- Color for DOWN Doji candles: Specify a color for downward Doji candles.
- Color for Perfect Doji candles: Define a color for perfectly balanced Doji candles.
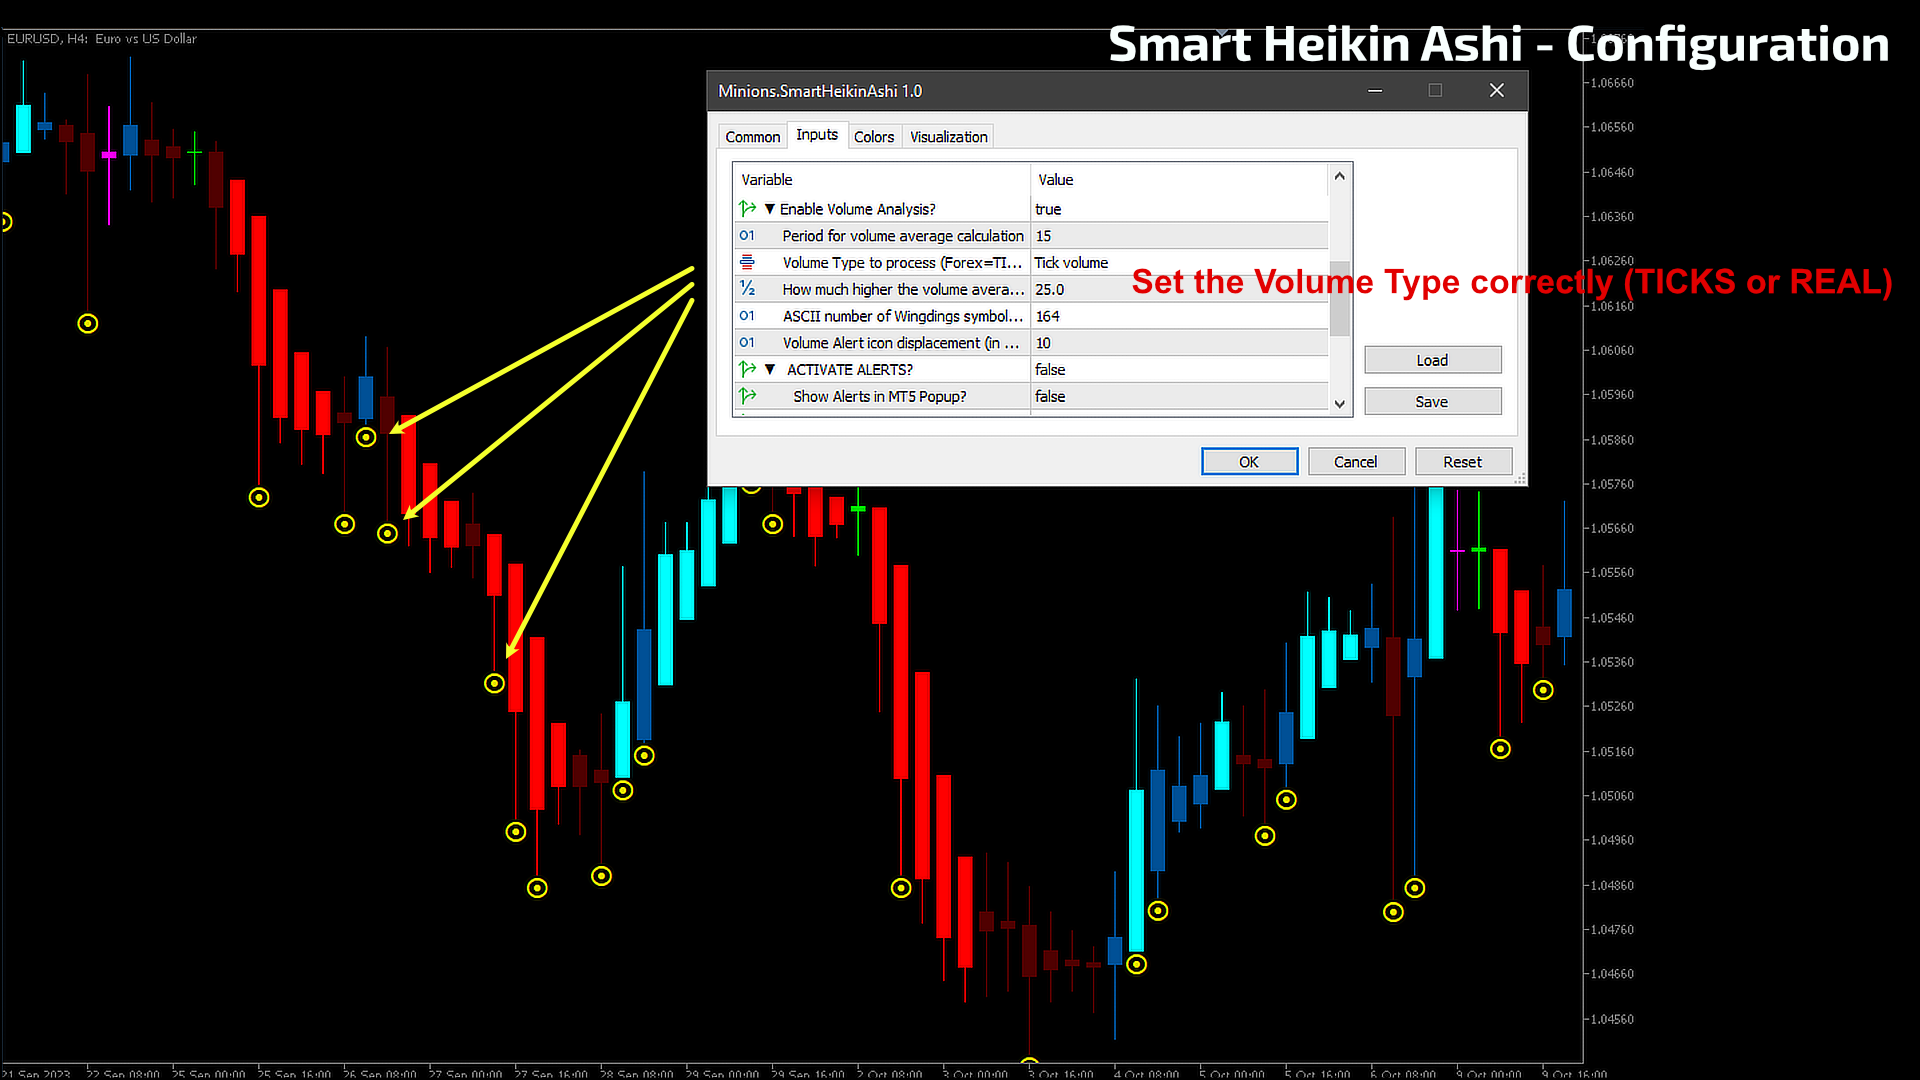
- --- VOLUME ANALYSIS ---
- Enable Volume Analysis? Toggle on or off the volume analysis feature.
- Period for volume average calculation: Set the period for calculating the average volume.
- Volume Type to process: Select whether to process volume as TICKS (for Forex), or REAL volume.
- Volume threshold (%): Define how much higher the volume must be compared to the average.
- Volume Alert icon displacement: Adjust the pixel displacement for volume alert icons.
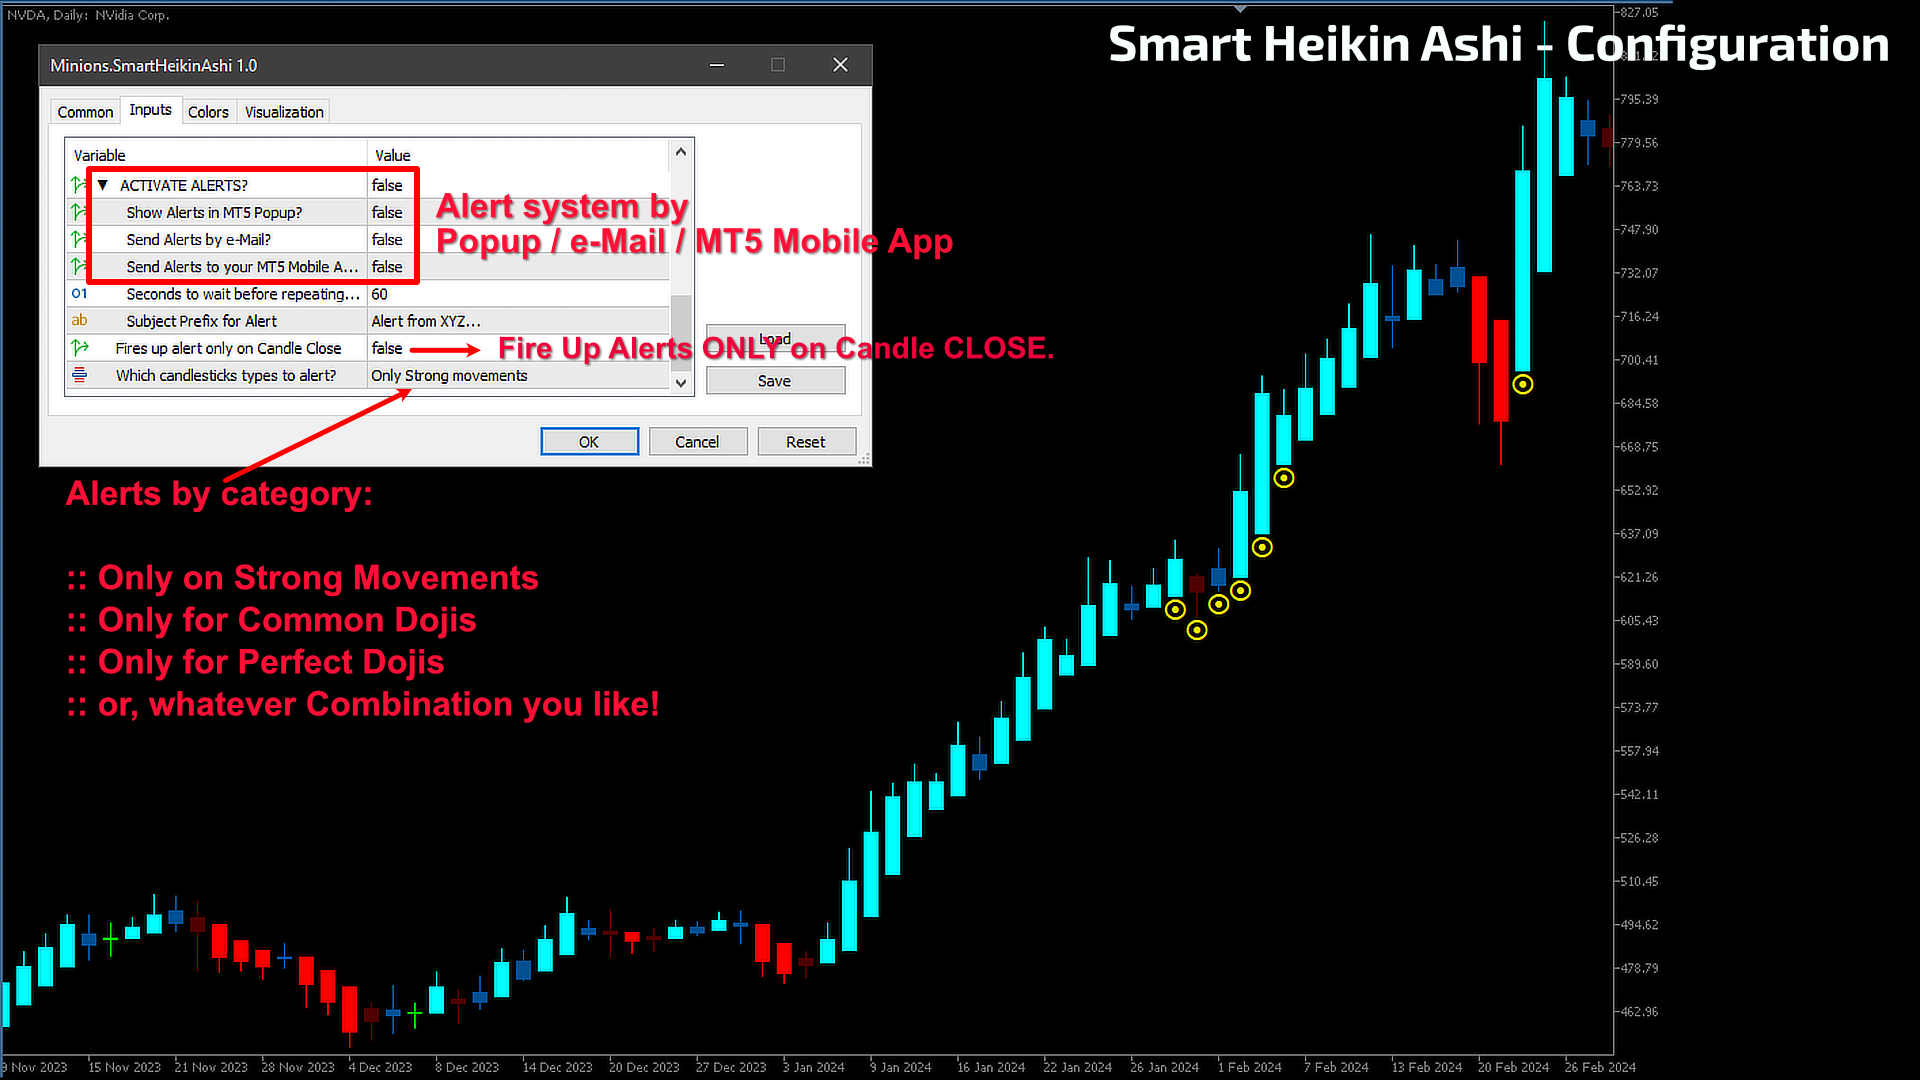
- --- ALERT SYSTEM ---
- Alert System: Activate or deactivate the alert system.
- Define the types of alerts you want: MT5 Popup / e-Mail / MT5 Mobile App.
- Define the time (in seconds) to wait after repeating a new alert.
- Define if you want realtime alerts or ON CANDLE CLOSE alerts.
- Define which types of movemets do you want to monitor: Only Strong Movements / Common Dojis / Perfect Dojis / A combination of whatever you want.
BUFFERS for your Expert Advisor
- Buffer #4 - Color system:
- _COLOR_UP_NORMAL = 0
- _COLOR_DOWN_NORMAL = 1
- _COLOR_UP_STRONG = 2
- _COLOR_DOWN_STRONG = 3
- _COLOR_UP_DOJI = 4
- _COLOR_DOWN_DOJI = 5
- _COLOR_PERFECT_DOJI = 6
- Buffer #5 - Higher volume - Any value > 0
Didn't Find a Feature You Need?
No tool is one-size-fits-all. If there's a feature you're missing in Smart Heikin Ashi, don't hesitate to contact us. Your input is invaluable as we strive to improve our offerings!
About Us
Minions Labs, founded by Flavio Jarabeck, is committed to boosting the capabilities of professional traders through advanced trading robots and indicators. Explore cutting-edge strategies across various markets and assets with our tailored solutions.