 MetaTrader 5
 Experts
 Indicateurs
 Scripts
 Bibliothèque
 Stockage
Voir comment télécharger gratuitement des robots de trading
Retrouvez-nous sur Twitter !
Rejoignez notre page de fans
Rejoignez notre page de fans
Vous avez aimé le script ? Essayez-le dans le terminal MetaTrader 5

Squeeze Momentum: Bollinger Bands Inside Keltner Channel - indicateur pour MetaTrader 5

- Vues:
- 62
- Note:
- Publié:
-
 Vous manquez des opportunités de trading :
- Applications de trading gratuites
- Plus de 8 000 signaux à copier
- Actualités économiques pour explorer les marchés financiers
Inscription Se connecterVous acceptez la politique du site Web et les conditions d'utilisation
Si vous n'avez pas de compte, veuillez vous inscrire -
 Besoin d'un robot ou d'un indicateur basé sur ce code ? Commandez-le sur Freelance
Aller sur Freelance

Squeeze Momentum: Bollinger Bands Inside Keltner Channel
The idea behind it
Markets alternate between quiet and active phases. A long quiet phase is often followed by a sharp move, but the direction of that move is not known in advance. The squeeze concept finds the quiet phase objectively by comparing two volatility envelopes:
- Bollinger Bands are based on the standard deviation of closing prices. They narrow quickly when closes cluster together.
- Keltner Channel is based on the average range (True Range) of the bars. It reacts more slowly and stays comparatively wide.
When the Bollinger Bands are completely inside the Keltner Channel, volatility has contracted to an unusually low level: the market is "squeezed". When the bands move back outside the channel, the squeeze is released and a directional move often follows.
To estimate the likely direction, the indicator also plots a momentum histogram: the linear regression of the distance between the close and the mid-line (the average of the middle of the highest-high/lowest-low range and the simple moving average of the close). Positive values mean that price is above its mid-line, negative values that it is below.
How to interpret it
- Dots on the zero line show the squeeze state of every bar: squeeze ON (Bollinger Bands inside the Keltner Channel; default color red), squeeze OFF (Bollinger Bands outside the channel; default color lime) and neither (default color gray; one band is inside and the other outside).
- Histogram – the momentum. Above zero: bullish bias; below zero: bearish bias. Four colors show whether the momentum is strengthening or weakening: positive and rising (lime) / positive and falling (green), negative and falling (red) / negative and rising (maroon). In the black & white figure the strengthening bars are drawn bright and the weakening bars dim.
- Release of the squeeze – the first bar after a series of "ON" dots is the potential signal. The sign and the direction of the histogram at that moment suggest the side of the move.
- Duration – the longer the squeeze lasts, the more energy is considered to be stored. The info label shows the number of consecutive squeeze bars.
- Info label (upper-left of the subwindow) – squeeze state of the current bar (ON with the bar count, OFF or none) and the current momentum value.
- Alert (optional) – when enabled, an alert appears when a squeeze is released on a closed bar, together with the side of the momentum (bullish or bearish).
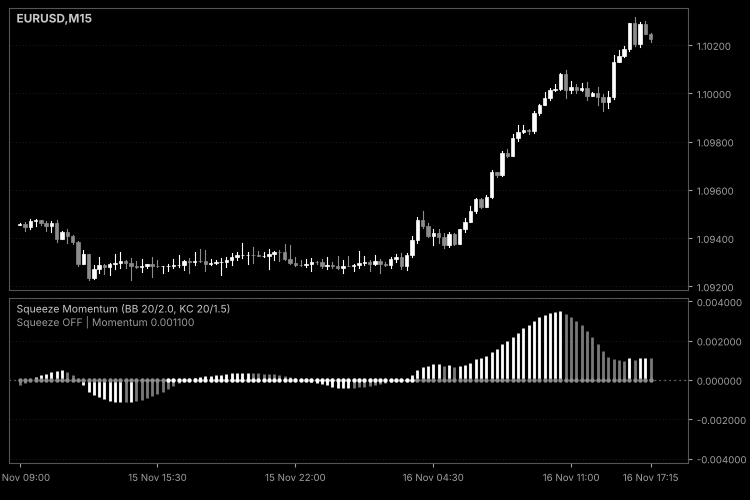
Fig. 1. Squeeze Momentum below an M15 chart: a squeeze (white dots on the zero line) during the consolidation and the momentum histogram after its release; black & white image per Code Base image guidelines (colors are configurable).
External variables (inputs)
| Input | Default | Purpose |
|---|---|---|
| InpBBLength | 20 | Period of the Bollinger Bands (2 or more). |
| InpBBMult | 2.0 | Standard deviation multiplier of the Bollinger Bands; must be greater than zero. |
| InpKCLength | 20 | Period of the Keltner Channel and of the momentum calculation (2 or more). |
| InpKCMult | 1.5 | Range multiplier of the Keltner Channel; must be greater than zero. Smaller values make a squeeze rarer and more significant. |
| InpUseTrueRange | true | Channel width: true uses the True Range of the bars, false uses the simple High−Low range. |
| InpAlert | false | Shows an alert when a squeeze is released on a closed bar. |
| InpShowInfoLabel | true | Shows the label with the squeeze state and the momentum value. |
| InpLabelColor | clrSilver | Color of the info label. |
The colors of the histogram and of the dots can be changed on the "Colors" tab of the indicator properties.
Recommended use
- Symbols and timeframes: works on any symbol and timeframe. Squeezes are most meaningful on liquid instruments and on M15–H4; on very low timeframes they are frequent and noisy.
- Trading context: the indicator shows when volatility is compressed and which side the momentum favors. It does not give entries by itself: many traders wait for the release of the squeeze and for confirmation by price (a breakout of the range) before acting, and place protective stops according to their own risk rules.
- Caveats: a squeeze can be released without a significant move or in the direction opposite to the momentum, and a release can be followed by a false start. The momentum is a smoothed value and lags; the last bar changes with every tick, so the dot and the last histogram bar can change before the bar closes. For this reason the alert is evaluated on closed bars only.
- Parameters: the classic settings are 20/2.0 for the Bollinger Bands and 20/1.5 for the Keltner Channel. Using a different multiplier for the Keltner Channel (for example 1.0 or 2.0) changes how often squeezes appear.
- Calculation: the indicator uses closing prices and simple averages. After the first full calculation only the forming bar and new bars are recalculated, and each bar needs only a short window of previous bars.
- Account types: the indicator does not trade and works identically on netting and hedging accounts.
- The info label is created in the indicator subwindow with a unique prefix and is removed when the indicator is deleted or reinitialized.
Truncation Audit: Detecting Look-Ahead and Repainting in MQL5 Indicators.
Part 3 of the indicator regression-testing series. Compares the value an indicator had when each bar closed with the value recomputed on the later history, flags every bar that changed (look-ahead or repainting), and measures how many future bars each value needed before it settled.
Volatility Regime Percentile
Ranks the current ATR against its own recent history and colours each bar as a LOW, NORMAL or HIGH volatility regime, with a panel showing ATR in price and points, ATR vs its median and how long the regime has held.
Donchian Channel with Breakout Alerts
Donchian Channel (highest high and lowest low of the last N bars) with a middle line, breakout arrows on the chart and alerts by pop-up window, push notification or e-mail when price breaks out of the channel.
Volatility Regime Indicator (Low, Normal, High) in a Subwindow
Classifies the current market volatility as Low, Normal or High by ranking the ATR against its own recent history. The percent rank is shown as a color-coded histogram in a subwindow, with optional alerts when the regime changes.