 MetaTrader 5
 Experts
 Indicateurs
 Scripts
 Bibliothèque
 Stockage
Voir comment télécharger gratuitement des robots de trading
Retrouvez-nous sur Twitter !
Rejoignez notre page de fans
Rejoignez notre page de fans
Vous avez aimé le script ? Essayez-le dans le terminal MetaTrader 5

Volatility Regime Percentile - indicateur pour MetaTrader 5

- Vues:
- 107
- Publié:
-
 Vous manquez des opportunités de trading :
- Applications de trading gratuites
- Plus de 8 000 signaux à copier
- Actualités économiques pour explorer les marchés financiers
Inscription Se connecterVous acceptez la politique du site Web et les conditions d'utilisation
Si vous n'avez pas de compte, veuillez vous inscrire -
 Besoin d'un robot ou d'un indicateur basé sur ce code ? Commandez-le sur Freelance
Aller sur Freelance


Volatility Regime Percentile answers a simple question: is the market quiet or busy right now compared with its own recent history? Instead of reading a raw ATR value that means something different on every symbol and timeframe, it converts ATR into a percentile rank from 0 to 100, so the same thresholds work on gold, oil, forex pairs and indices.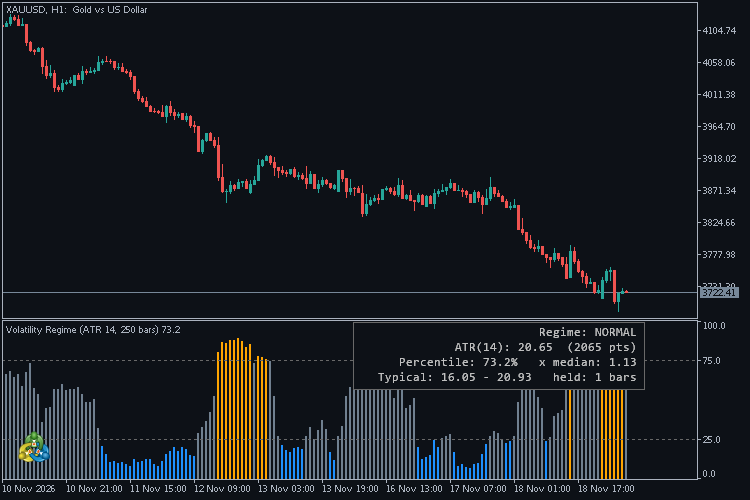
How it works
- The indicator calculates the ATR (default 14) on the chart timeframe.
- For every bar it looks at the last N bars (default 250) and counts the share of them whose ATR was less than or equal to the current ATR. That share is the percentile rank.
- The histogram is coloured by regime:
- Blue - LOW volatility: percentile at or below the low threshold (default 25)
- Grey - NORMAL volatility
- Orange - HIGH volatility: percentile at or above the high threshold (default 75)
- Dotted levels mark the two thresholds.
Panel
- Current regime (coloured).
- ATR in price and in points (for example on XAUUSD with 3-digit pricing, 20.65 = 2065 points).
- Percentile and ATR vs median of the lookback window (1.00 = typical, 1.50 = 50% above typical).
- Typical range: the 25th and 75th percentile ATR values of the window.
- Held: how many bars the current regime has lasted.
Ideas for use
- Size stop-losses and targets to the current regime instead of fixed values.
- Spot compression (long LOW stretches) that often comes before expansion.
- Filter strategies: for example, trade breakouts only in NORMAL/HIGH regimes, or mean-reversion only in LOW regimes.
- Compare sessions: on gold and oil the regime usually changes around the London and New York opens.
Alerts
Optional alert when a closed bar changes regime (one alert per bar).
Notes
- Works on any symbol and timeframe. It needs at least ATR period + lookback bars of history.
- Information only. It does not open, close or modify trades, and it does not predict price direction.
Inputs
| Input | Default | Description |
|---|---|---|
| ATR period | 14 | Period of the ATR |
| Lookback bars for the percentile rank | 250 | Window used to rank the current ATR |
| Low-volatility threshold (percentile) | 25 | At or below = LOW regime |
| High-volatility threshold (percentile) | 75 | At or above = HIGH regime |
| Show info panel | true | Shows the panel in the indicator window |
| Panel on the right side | true | false = left side |
| Panel text colour | Silver | Colour of the panel text |
| Panel font size | 9 | Font size of the panel |
| Alert when a closed bar changes regime | false | Pop-up alert on a regime change |
 Trade Settings — Persist and Migrate Per-Trade Settings
Standalone MQL5 library for storing custom settings separately for each trade and following a verified pending-order-to-position lifecycle. It supports double, ulong and price-unit fields, terminal-local Global Variables, safe cleanup gates and an offline self-test. Includes a demo EA, source archive, and installation guide. A different-ticket transition, reconnection as a separate scenario, and netting behavior remain untested.
Building a Confluence Signal Engine in MQL5: Leading Triggers, Confirmation Filters and a Live Dashboard
Free source code included: a DST-aware Market Sessions + PVSRA vector-candle indicator, 5 preset files and a printable confluence cheat sheet.
Truncation Audit: Detecting Look-Ahead and Repainting in MQL5 Indicators.
Part 3 of the indicator regression-testing series. Compares the value an indicator had when each bar closed with the value recomputed on the later history, flags every bar that changed (look-ahead or repainting), and measures how many future bars each value needed before it settled.
Squeeze Momentum: Bollinger Bands Inside Keltner Channel
Squeeze Momentum indicator: detects periods of volatility compression, when the Bollinger Bands move inside the Keltner Channel, and shows the direction and strength of the momentum that builds up during and after the squeeze.