 MetaTrader 5
 Experts
 Indicateurs
 Scripts
 Bibliothèque
 Stockage
Voir comment télécharger gratuitement des robots de trading
Retrouvez-nous sur Telegram !
Rejoignez notre page de fans
Rejoignez notre page de fans
Vous avez aimé le script ? Essayez-le dans le terminal MetaTrader 5

Donchian Channel with Breakout Alerts - indicateur pour MetaTrader 5

- Vues:
- 66
- Note:
- Publié:
-
 Vous manquez des opportunités de trading :
- Applications de trading gratuites
- Plus de 8 000 signaux à copier
- Actualités économiques pour explorer les marchés financiers
Inscription Se connecterVous acceptez la politique du site Web et les conditions d'utilisation
Si vous n'avez pas de compte, veuillez vous inscrire -
 Besoin d'un robot ou d'un indicateur basé sur ce code ? Commandez-le sur Freelance
Aller sur Freelance

Donchian Channel with Breakout Alerts
The idea behind it
The Donchian Channel, developed by Richard Donchian, is one of the simplest trend-following tools. Its upper band is the highest high and its lower band is the lowest low of the last N bars; the middle line is their average. A price that moves beyond the channel has made a new N-bar high or low, which is the basis of the classic "channel breakout" approach (used, for example, in the Turtle trading rules).
The channel itself contains the current bar, so the bar can never leave it. Therefore the indicator compares every bar with the channel of the previous bar: a bar that closes above the previous upper band (or below the previous lower band) is a breakout. The arrow is drawn only on the first bar of a breakout, not on every following bar outside the channel, and an alert is sent once per bar.
How to interpret it
- Upper band (solid line) – the highest high of the last InpPeriod bars. Rising steps show new highs.
- Lower band (solid line) – the lowest low of the last InpPeriod bars. Falling steps show new lows.
- Middle line (dotted line, optional) – the average of the bands; it can be used as a dynamic equilibrium level or a trailing reference.
- Up arrow below the bar – a bullish breakout: the bar broke above the previous upper band.
- Down arrow above the bar – a bearish breakout: the bar broke below the previous lower band.
- Channel width – a narrow channel means a quiet market and low volatility; a widening channel means that volatility is rising.
- Info label (upper-left corner of the chart) – the current upper and lower band, the channel width in points, and the status of the current bar: Inside, Breakout UP or Breakout DOWN.
- Alerts – sent when a new breakout signal appears; the message contains the symbol, timeframe, direction and price.
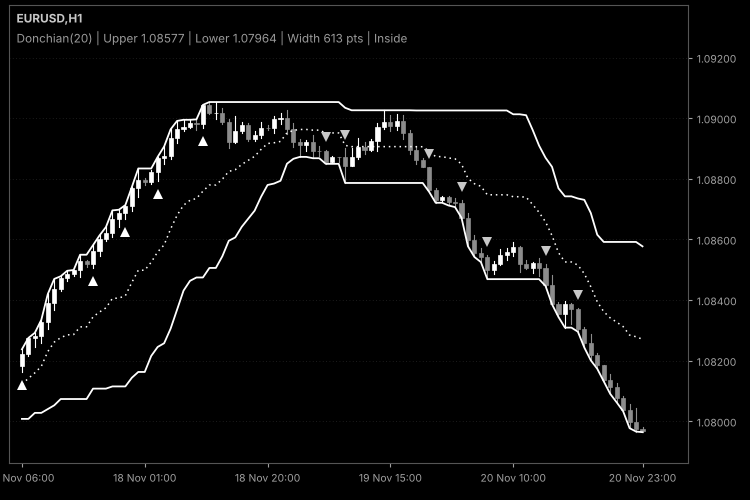
Fig. 1. Donchian Channel (20) on an H1 chart with the middle line and breakout arrows: bullish breakouts below the bars, bearish breakouts above the bars; black & white image per Code Base image guidelines (colors are configurable).
External variables (inputs)
| Input | Default | Purpose |
|---|---|---|
| InpPeriod | 20 | Number of bars used for the highest high and the lowest low (2 or more). |
| InpShowMiddle | true | Shows the middle line of the channel. |
| InpBreakoutBy | DON_BREAKOUT_CLOSE | Breakout condition: the close beyond the previous channel (DON_BREAKOUT_CLOSE) or the high above / the low below it (DON_BREAKOUT_EXTREME). |
| InpShowArrows | true | Draws the breakout arrows on the chart (alerts work regardless of this setting). |
| InpAlertPopup | true | Shows an alert window. |
| InpAlertPush | false | Sends a push notification to the mobile terminal. |
| InpAlertEmail | false | Sends an e-mail. |
| InpAlertOnBarClose | true | true: the alert refers to the last closed bar; false: the alert is sent as soon as the forming bar fulfills the condition. |
| InpShowInfoLabel | true | Shows the label with the channel values, width and status. |
| InpLabelColor | clrSilver | Color of the info label. |
The colors and line styles of the bands and the arrows can be changed on the "Colors" tab of the indicator properties.
Recommended use
- Symbols and timeframes: works on any symbol and timeframe. Breakout methods suit instruments that trend, and are more reliable on M30–D1; in a sideways market they produce frequent false breakouts. Longer periods give fewer and stronger signals, shorter periods give earlier but noisier ones.
- Close or extreme: the close-based condition filters out spikes with long wicks and is the recommended default; the high/low condition reacts earlier but gives more false signals. If a bar breaks the channel on both sides, the direction of the candle is used.
- Alerts: with InpAlertOnBarClose = true the signal cannot disappear, but it arrives one bar later. With false the alert is faster, but a breakout on the forming bar may not hold until the close; an alert is still sent only once per bar and direction. No alerts are sent for the history that is present when the indicator is started. To use push notifications or e-mail, configure them in the terminal settings first.
- Caveats: the channel is a lagging tool and a breakout is no guarantee of a trend. Spreads, gaps and news can affect the signals. Use the arrows as additional information together with your own entry rules and risk management.
- Calculation: after the first full calculation only the forming bar and new bars are recalculated, and the highest high and the lowest low are found within a window of InpPeriod bars.
- Account types: the indicator does not trade and works identically on netting and hedging accounts.
- The info label is created with a unique prefix and removed when the indicator is deleted or reinitialized.
Squeeze Momentum: Bollinger Bands Inside Keltner Channel
Squeeze Momentum indicator: detects periods of volatility compression, when the Bollinger Bands move inside the Keltner Channel, and shows the direction and strength of the momentum that builds up during and after the squeeze.
Truncation Audit: Detecting Look-Ahead and Repainting in MQL5 Indicators.
Part 3 of the indicator regression-testing series. Compares the value an indicator had when each bar closed with the value recomputed on the later history, flags every bar that changed (look-ahead or repainting), and measures how many future bars each value needed before it settled.
Volatility Regime Indicator (Low, Normal, High) in a Subwindow
Classifies the current market volatility as Low, Normal or High by ranking the ATR against its own recent history. The percent rank is shown as a color-coded histogram in a subwindow, with optional alerts when the regime changes.
 Chart Indicators to CSV
A script for MetaTrader 5 that exports the raw values of all buffers of every indicator on a chart to one CSV file, without changing any code.