 MetaTrader 5
 Experts
 Indicateurs
 Scripts
 Bibliothèque
 Stockage
Voir comment télécharger gratuitement des robots de trading
Retrouvez-nous sur Facebook !
Rejoignez notre page de fans
Rejoignez notre page de fans
Vous avez aimé le script ? Essayez-le dans le terminal MetaTrader 5

Volatility Regime Indicator (Low, Normal, High) in a Subwindow - indicateur pour MetaTrader 5

- Vues:
- 71
- Publié:
-
 Vous manquez des opportunités de trading :
- Applications de trading gratuites
- Plus de 8 000 signaux à copier
- Actualités économiques pour explorer les marchés financiers
Inscription Se connecterVous acceptez la politique du site Web et les conditions d'utilisation
Si vous n'avez pas de compte, veuillez vous inscrire -
 Besoin d'un robot ou d'un indicateur basé sur ce code ? Commandez-le sur Freelance
Aller sur Freelance

The idea behind it
Volatility is not constant: markets alternate between quiet and turbulent phases, and the same strategy, stop distance or position size can behave very differently in each of them. An absolute ATR value is hard to judge on its own, because what is "high" depends on the symbol, the timeframe and the period of time.
This indicator answers a simpler question: is volatility currently high or low compared with the recent past of the same symbol? For every bar it calculates the ATR (Wilder smoothing), optionally expressed in percent of the close so that long price trends do not distort the comparison, and then calculates its percent rank: the share of the previous InpLookback values that were lower than the current one. A rank of 90 means that the current volatility is higher than 90% of the recent bars.
The rank is then split into three regimes using two thresholds: Low (rank at or below InpLowPercentile), High (rank at or above InpHighPercentile) and Normal in between.
How to interpret it
- Histogram – the percent rank of the volatility, on a fixed scale from 0 to 100.
- Color of the bars – the regime: Low (default blue), Normal (default gray) and High (default orange-red). In the black & white figure the shades are dark gray, medium gray and white respectively.
- Dotted levels – the two thresholds (InpLowPercentile and InpHighPercentile, 25 and 75 by default) that separate the regimes.
- Info label (upper-left of the subwindow) – the current regime, the number of consecutive bars in it, the rank, and the current ATR (in percent of the close, or in points when normalization is off).
- Alert (optional) – when enabled, an alert is shown when the regime changes between two closed bars, for example from Normal to High.
- Typical reading – a long Low regime means compressed volatility and is often followed by an expansion; a High regime means large price swings, which usually calls for wider stops and smaller position sizes, and tends to calm down after a while.
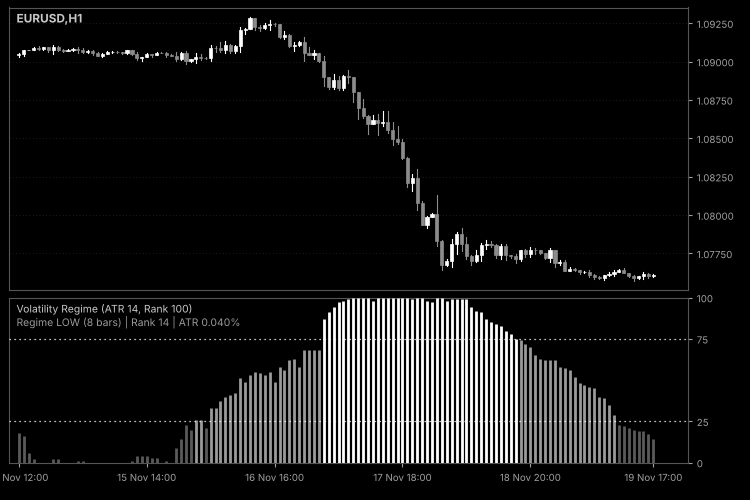
Fig. 1. Volatility Regime below an H1 chart: low volatility, then a High regime during a sharp decline, then calming; black & white image per Code Base image guidelines (colors are configurable).
External variables (inputs)
| Input | Default | Purpose |
|---|---|---|
| InpATRPeriod | 14 | Period of the ATR (2 or more). |
| InpNormalize | true | true: the ATR is measured in percent of the close; false: in price units. |
| InpLookback | 100 | Number of previous bars used for the percent rank (10 or more). |
| InpLowPercentile | 25.0 | Rank at or below this value means the Low regime. Must be greater than 0 and less than the high percentile. |
| InpHighPercentile | 75.0 | Rank at or above this value means the High regime. Must be less than 100. |
| InpAlertOnChange | false | Shows an alert when the regime changes between two closed bars. |
| InpShowInfoLabel | true | Shows the label with the regime, rank and ATR. |
| InpLabelColor | clrSilver | Color of the info label. |
The colors of the three regimes can be changed on the "Colors" tab of the indicator properties.
Recommended use
- Symbols and timeframes: works on any symbol and timeframe. Because the regime is relative to the symbol's own history, the same thresholds can be used across instruments. On intraday charts the volatility has a daily rhythm (for example, it is higher at the market open), so a High regime around the session open is partly normal; use a longer InpLookback to reduce this effect.
- Lookback: a short lookback adapts quickly but changes regime often; a long lookback is more stable but reacts slowly to a change in market conditions. The indicator needs InpATRPeriod + InpLookback bars before it starts drawing.
- Thresholds: 25/75 splits the history in quarters, so a Low or High regime is by definition not rare. Use 10/90 if you want only extreme conditions.
- Typical applications: adjusting stop distances or position size to the regime, switching between a trend-following and a range-trading approach, and filtering signals of other indicators (for example, ignoring breakouts in a Low regime). The indicator measures the size of price movement only; it does not show the direction.
- Caveats: the rank of the last bar changes with every tick until the bar closes. A rank is a relative measure: if the whole recent history was extremely volatile, a "Normal" regime can still mean large moves. The regime is detected after the volatility has already changed, so it describes the present state and does not predict the next one.
- Calculation: after the first full calculation only the forming bar and new bars are recalculated; the ATR is updated recursively and the rank needs one pass over the lookback window per bar.
- Account types: the indicator does not trade and works identically on netting and hedging accounts.
- The info label is created in the indicator subwindow with a unique prefix and removed when the indicator is deleted or reinitialized.
Donchian Channel with Breakout Alerts
Donchian Channel (highest high and lowest low of the last N bars) with a middle line, breakout arrows on the chart and alerts by pop-up window, push notification or e-mail when price breaks out of the channel.
Squeeze Momentum: Bollinger Bands Inside Keltner Channel
Squeeze Momentum indicator: detects periods of volatility compression, when the Bollinger Bands move inside the Keltner Channel, and shows the direction and strength of the momentum that builds up during and after the squeeze.
 Chart Indicators to CSV
A script for MetaTrader 5 that exports the raw values of all buffers of every indicator on a chart to one CSV file, without changing any code.
Daily Range Budget
Shows how much of the average daily range (ADR) has already been used today, and plots the two prices that today’s high and low could still reach if the day ends with an average range. Shows how much of the average daily range (ADR) has already been used today, and draws the two prices that today’s high and low can still reach if the day ends with an average range.