Rejoignez notre page de fans

RSI adaptive EMA ribbon - indicateur pour MetaTrader 5

- Vues:
- 7346
- Note:
- Publié:
- Mise à jour:
-
 Vous manquez des opportunités de trading :
- Applications de trading gratuites
- Plus de 8 000 signaux à copier
- Actualités économiques pour explorer les marchés financiers
Inscription Se connecterVous acceptez la politique du site Web et les conditions d'utilisation
Si vous n'avez pas de compte, veuillez vous inscrire -
 Besoin d'un robot ou d'un indicateur basé sur ce code ? Commandez-le sur Freelance
Aller sur Freelance
Besoin d'un robot ou d'un indicateur basé sur ce code ? Commandez-le sur Freelance
Aller sur Freelance
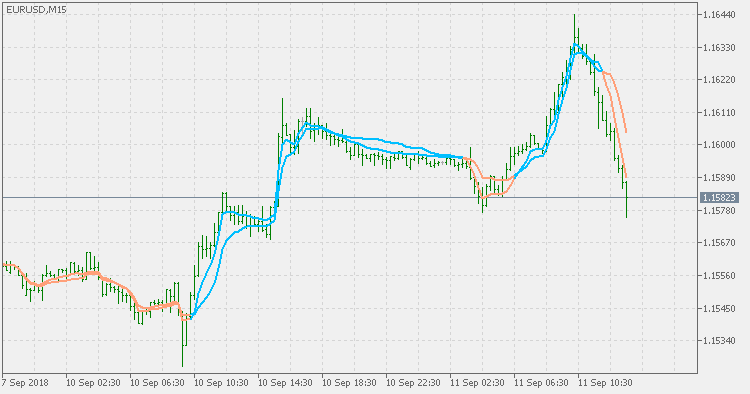
The background :
This indicator is using the RSI adaptive EMA (originally published here : RSI adaptive EMA) to assess the market condition. Even though it can be translated (and was done so) to a MACD, the on-chart representation of what is used for MACD calculation can help in easier spotting of possible trend changes
Of parameters :
Just the usual parameters : fast rsi period , slow rsi period and the price used. Take care that the fast is faster than the slow period - since then the results can be unpredictable (I did not add a code to check that - the assumption is that the user can do whatever she/he can do as a part of experimenting)
Usage :
Simple color change of the two values indicates a possible start of a new trend and can be used as a signal
RSI adaptive EMA - floating levels
RSI adaptive EMA - floating levels
Range Action Verification Index - extended
Range Action Verification Index - extended