Rejoignez notre page de fans

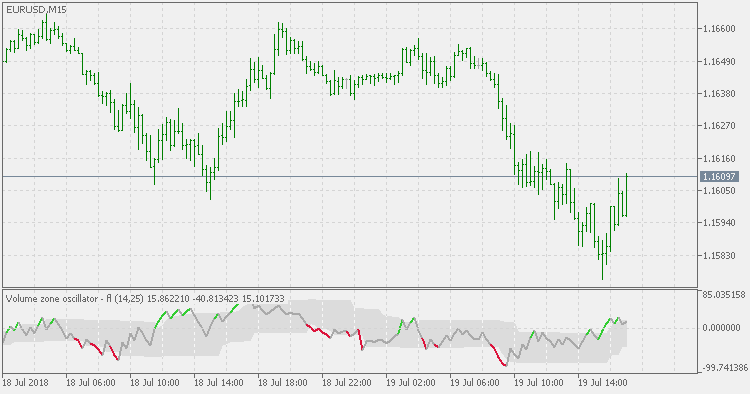
Volume Zone Oscillator - Floating Levels - indicateur pour MetaTrader 5

- Vues:
- 15305
- Note:
- Publié:
-
 Vous manquez des opportunités de trading :
- Applications de trading gratuites
- Plus de 8 000 signaux à copier
- Actualités économiques pour explorer les marchés financiers
Inscription Se connecterVous acceptez la politique du site Web et les conditions d'utilisation
Si vous n'avez pas de compte, veuillez vous inscrire -
 Besoin d'un robot ou d'un indicateur basé sur ce code ? Commandez-le sur Freelance
Aller sur Freelance
Besoin d'un robot ou d'un indicateur basé sur ce code ? Commandez-le sur Freelance
Aller sur Freelance
Indicator is based on the "In The Volume Zone" article by Walid Khalil and David Steckler.
An axiom of technical analysis states that with few exceptions, all technical indicators can be classified as either trending or oscillating (non-trending) in their design. This new indicator, the Volume Zone Oscillator (VZO), addresses both. In his book Technical Analysis Of The Financial Markets, John J. Murphy explains that using oscillators provides three benefits:
- Overbought and oversold conditions warn that price trend is overextended and vulnerable.
- Divergence between oscillator and price action shows hidden strength or weakness in the market, which is not apparent in the price action.
- The crossing of the zero line can give an important trading signal.
Compared to the Volume Zone Oscillator indicator, this version is additionally using floating levels to determine the trend.
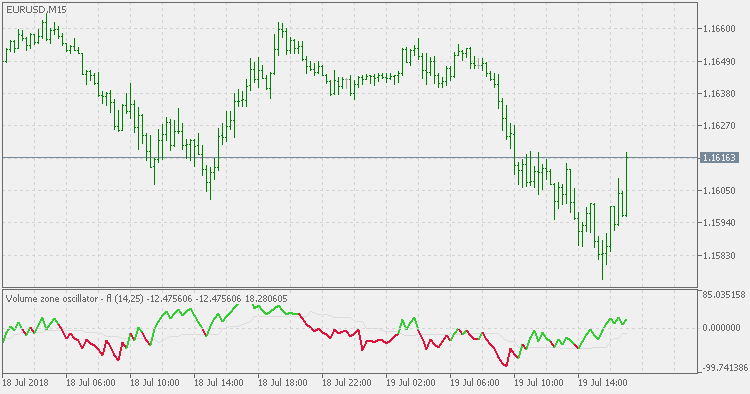
PS: to have trend determined on a sort of a dynamic zero line, use levels 50 for both up and down. In that case you shall have something like this:
Volume Zone Oscillator
Volume Zone Oscillator indicator is based on the "In The Volume Zone" article by Walid Khalil and David Steckler, and can be classified as both trending and oscillating (non-trending) in its design.
WPR Candles
This indicator is a variation of a well known WPR (Williams Percent Range) indicator with 4 WPR values combined into "candles".
QQE New
Compared to the original QQE indicator, this version instead of using trailing levels uses fixed levels to estimate overbought and oversold conditions.
QQE Histo
Compared to the original QQE indicator, this version is adding fixed levels (to help further estimate the trend) and color changing histogram (based on those levels).