Rejoignez notre page de fans

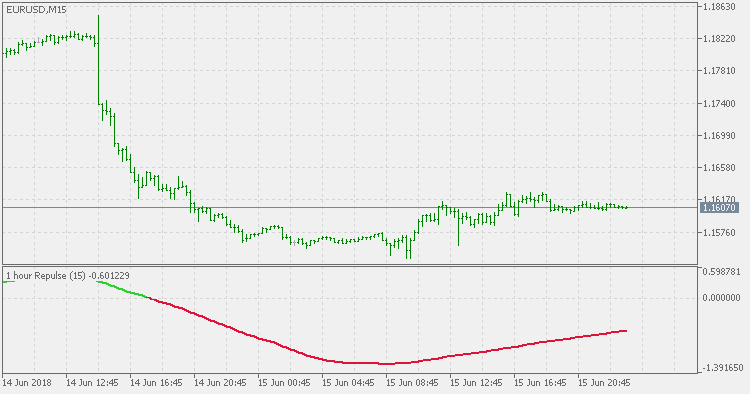
Repulse Multi Timeframe - indicateur pour MetaTrader 5

- Vues:
- 7986
- Note:
- Publié:
-
 Vous manquez des opportunités de trading :
- Applications de trading gratuites
- Plus de 8 000 signaux à copier
- Actualités économiques pour explorer les marchés financiers
Inscription Se connecterVous acceptez la politique du site Web et les conditions d'utilisation
Si vous n'avez pas de compte, veuillez vous inscrire -
 Besoin d'un robot ou d'un indicateur basé sur ce code ? Commandez-le sur Freelance
Aller sur Freelance
Besoin d'un robot ou d'un indicateur basé sur ce code ? Commandez-le sur Freelance
Aller sur Freelance
The Repulse Multi Timeframe indicator measures and displays the bullish or bearish pressure associated with each price candlestick in the form of a curve.
This version is a standalone multi timeframe version (Repulse indicator is needed for its work).
Timeframes supported are all the possible timeframes supported by MetaTrader 5 and it has 3 "special" timeframes:
- Next higher timeframe: first higher timeframe compared to active chart.
- Second higher timeframe: second higher timeframe compared to active chart.
- Third higher timeframe: third higher timeframe compared to active chart.
If some of these 3 timeframes are used, then the timeframe is set automatically as you change the timeframe of the chart.
Log Sigmoidal Normalized Jurik MA
In this indicator Jurik MA is sigmoidal (Softmax) normalized - made as oscillator that ranges in 0 to 1 range, and if you use hyperbolic normalization it will range from -1 to +1 range.
Repulse
The Repulse indicator measures and displays the bullish or bearish pressure associated with each price candlestick in the form of a curve.
Dollar Index
The U.S. Dollar Index (USDX, DXY, DX) is an index (or measure) of the value of the United States dollar relative to a basket of foreign currencies, often referred to as a basket of U.S. trade partners' currencies. The Index goes up when the U.S. dollar gains "strength" (value) when compared to other currencies.
Dollar Index Candles
Compared to the Dollar Index indicator, this version is a bit different: instead of showing just one value, it is displaying the "open", "close", "high" and "low" of dollar index as candles in a separate window. That way you can see the volatility of the dollar index intra bar change too and it displays values closer to our normal assumption how the index is formed.