Rejoignez notre page de fans

Cumulative_Volume - indicateur pour MetaTrader 5
- Vues:
- 7540
- Note:
- Publié:
-
 Vous manquez des opportunités de trading :
- Applications de trading gratuites
- Plus de 8 000 signaux à copier
- Actualités économiques pour explorer les marchés financiers
Inscription Se connecterVous acceptez la politique du site Web et les conditions d'utilisation
Si vous n'avez pas de compte, veuillez vous inscrire -
 Besoin d'un robot ou d'un indicateur basé sur ce code ? Commandez-le sur Freelance
Aller sur Freelance
Besoin d'un robot ou d'un indicateur basé sur ce code ? Commandez-le sur Freelance
Aller sur Freelance
This oscillator indicator provides an interesting method for presenting volume data. It displays the total volume over the selected period.
Volume data can be represented in several ways:
- Combined
- Absolute
- Relative
- Separated
- Absolute
- Relative
Volumes can be displayed in relative or absolute values, as well as in a combined or a separated way.
The indicator has three input parameters:
- Period - calculation period;
- Combined - show data either in a combined or in a separated way (Yes/No);
- Relative - choose between relative/absolute values (Yes/No).
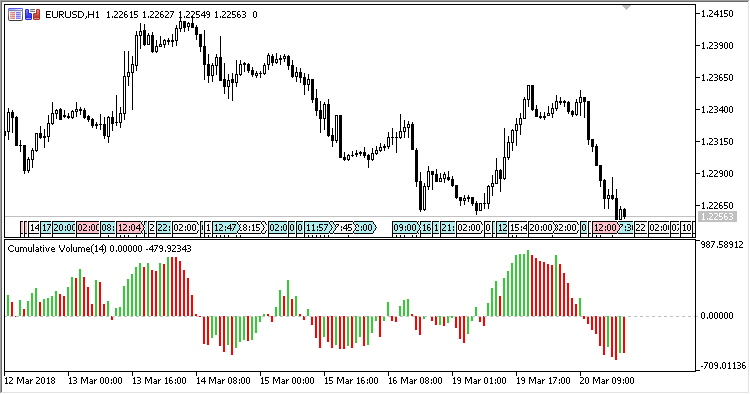
Fig.1. Combined, relative representation
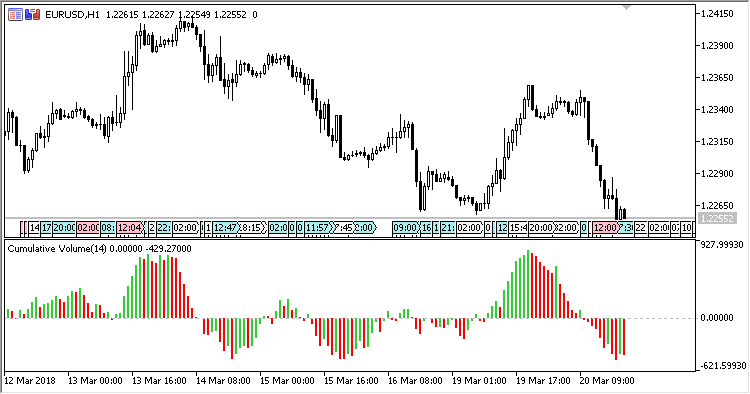
Fig.2. Combined, non-relative representation
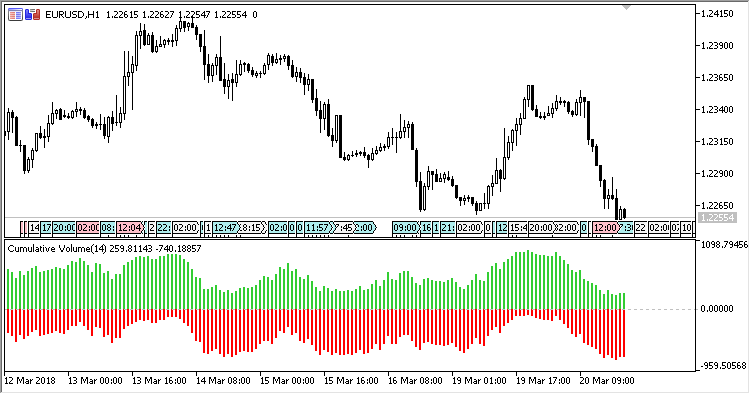
Fig.3. Non-combined, relative representation
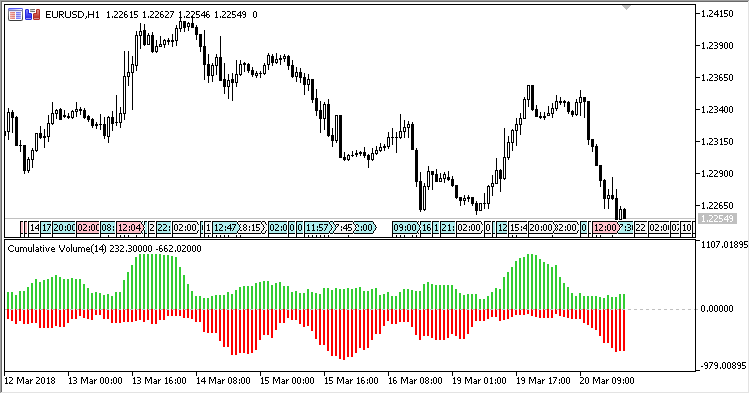
Fig.4. Non-combined, non-relative representation
Traduit du russe par MetaQuotes Ltd.
Code original : https://www.mql5.com/ru/code/20267
SHL_MA_Band
A trend indicator: Smoothed High/Low Linear regression band.
HL_MA_Band
A trend indicator: High/Low Linear regression band.
MA_Difference
An oscillator indicator showing a difference between MA and the price.
Period_Open_Line
The indicator shows the open price of a period.