Rejoignez notre page de fans
- Publié par:
- Vues:
- 21433
- Note:
- Publié:
- Mise à jour:
-
 Vous manquez des opportunités de trading :
- Applications de trading gratuites
- Plus de 8 000 signaux à copier
- Actualités économiques pour explorer les marchés financiers
Inscription Se connecterVous acceptez la politique du site Web et les conditions d'utilisation
Si vous n'avez pas de compte, veuillez vous inscrire -
 Besoin d'un robot ou d'un indicateur basé sur ce code ? Commandez-le sur Freelance
Aller sur Freelance
Besoin d'un robot ou d'un indicateur basé sur ce code ? Commandez-le sur Freelance
Aller sur Freelance

Real author:
TrendLaboratory
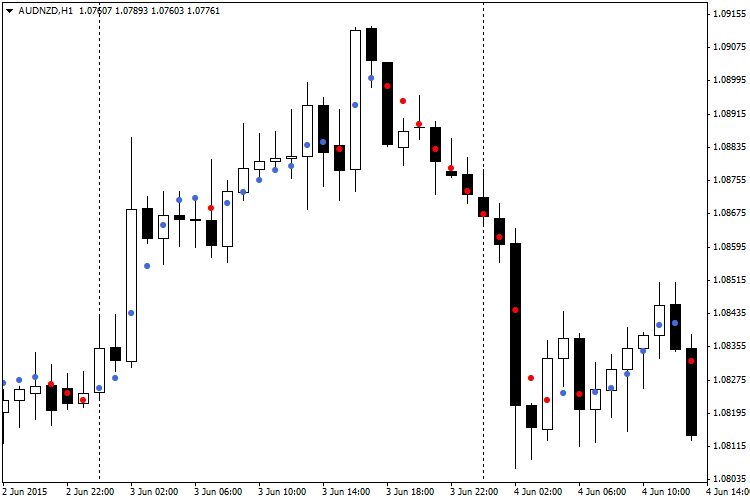
The Dots indicator is based on an indicator developed by TrendLaboratory in 2006. The indicator shows current trend direction by placing colored dots on the main chart. Blue dots indicate an uptrend, red dots indicate a downtrend.
Although the indicator calculation is not based on standard MetaTrader platform indicators, it uses the iMA (Moving Average) function to get prices of a specified type (Open, Close, Maximum, Minimum, Typical etc.). The calculation is based on cosine of a price change angle. The user can set several input parameters.
Input Parameters:
- Length (by default = 10) — indicator period. The higher this value, the higher the time lag, and the fewer false signals are displayed.
- AppliedPrice (by default = PRICE_CLOSE) — price type to use in calculations.
- Filter (by default = 0) — useful parameter allowing to filter price surges without adding display lags.
- Deviation (by default = 0) — vertical indicator shift.
- Shift (by default = 0) — horizontal indicator shift.
Recommendations:
- Recommended strategy is to wait for 2 identical dots and open positions by trend. Unfortunately, sometimes it fails. A suitable alternative would be to use one dot as a signal with Filter parameter set as Spread x 3.
Traduit du russe par MetaQuotes Ltd.
Code original : https://www.mql5.com/ru/code/13179
 WRB
WRB
The indicator detects and marks the WRB (Wide Range Bars) or candlesticks with Wide Range Bodies.
Divergence Petr
The indicator of divergences on 30 oscillators of choice.
Easy Trend Visualizer
A simple visualizer of trends.
GainLossInfo
Shows the current gain and loss for the candlesticks on the chart.