Sniper Bullet Trender
- Indicadores
- Versión: 1.2
- Actualizado: 15 junio 2022
- Activaciones: 20

Este indicador combina la entrada de dos filtros de tendencia y el ADX. Puede cambiar la línea de tendencia en el gráfico según sus preferencias.
Ideal para scalping y canales.
Cuenta con función de alerta y el parámetro TrendLinePeriod.
Cómo utilizarlo:
Simplemente adjuntar a cualquier gráfico.
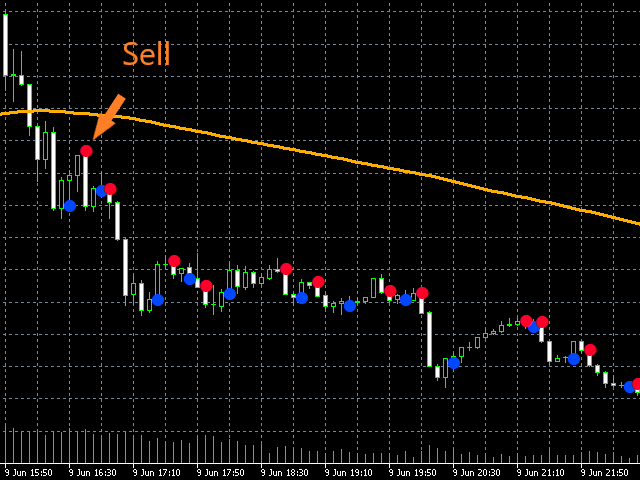
Venda en las viñetas rojas, con la línea de tendencia por encima del precio. Entre en las balas más cercanas a esta línea.
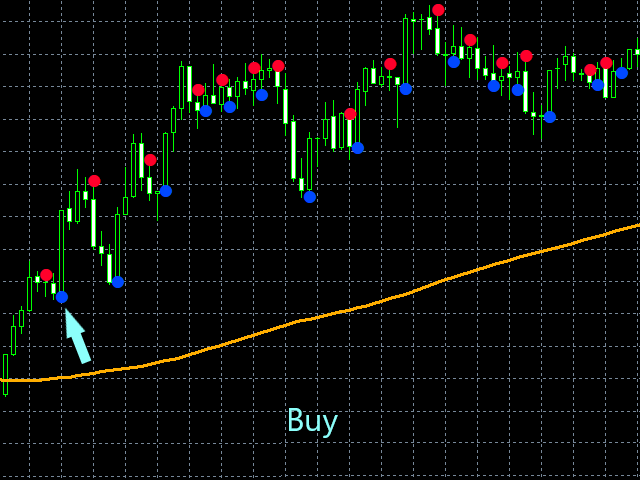
Comprar en las balas azules, con la línea de tendencia por debajo del precio. Entre en las balas más cercanas a esta línea.
Los mejores resultados se obtienen cuando se comprueban los marcos temporales superiores antes de entrar en operaciones en los marcos temporales inferiores.
Utilícelo como mejor le convenga para su estrategia.
Mejores resultados en los pares principales, pero también se puede utilizar en otros pares.
Importante a tener en cuenta:
-
Por favor, no utilice este indicador al azar. Asegúrese de que complementa su estrategia.
-
No arriesgue dinero que no pueda permitirse perder.
-
Utilice este indicador bajo su propio riesgo. Por favor, aplique la gestión del dinero sabiamente.
-
Pruebe siempre su estrategia en una cuenta demo antes de utilizar un nuevo indicador en una cuenta real.

I bought this indicator because there are many interesting elements, I am a scalper and this indicator is a perfect complement