KT Average Daily Range MT4
- Indicadores
-
KEENBASE SOFTWARE SOLUTIONS
 Keenbase Trading desarrolla indicadores profesionales y Asesores Expertos (Expert Advisors) para MetaTrader 4 y MetaTrader 5, diseñados para ayudar a los traders a tomar decisiones de trading más informadas.
 - Versión: 1.1
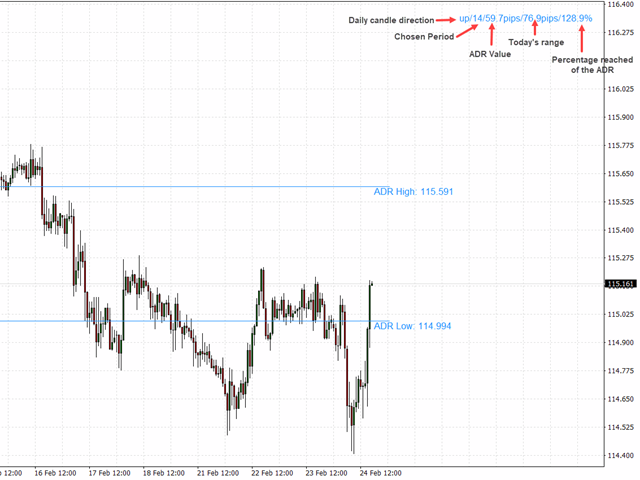
KT Average Daily Range(ADR) muestra los niveles superior e inferior utilizando el rango medio diario cubierto por el par de divisas o el instrumento. El rango medio diario se calcula utilizando el periodo elegido en los ajustes de entrada.
ADRHigh: El nivel superior del ADR se obtiene sumando el valor del rango medio diario al nivel inferior del día actual.
ADR Low: El nivel inferior del ADR se obtiene restando el valor del ADR al nivel superior del día actual.
Características
- Muestra los niveles ADR junto con otra información útil para los operadores (en la esquina superior derecha del gráfico).
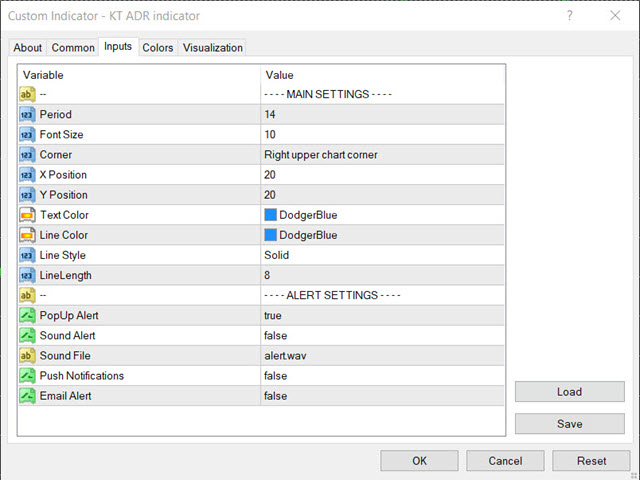
- Totalmente personalizable.
- Incluye todas las alertas de Metatrader.
Fórmula ADR
- ADR = (D1+D2+D3+D4+ .....+ Dn) / P - - - - -
Donde,
D es el rango cubierto por los días correspondientes.
P es el periodo elegido.
Aplicaciones
- Los niveles ADR pueden utilizarse como stop-loss y objetivo de beneficios.
- Los operadores pueden utilizarlos para diseñar estrategias de inversión utilizando los principios de reversión a la media en torno a los niveles ADR.
- En ocasiones, los niveles ADR también sirven para identificar las posibles zonas de soporte/resistencia.

great