Chart Clipper
- Indicadores
- Versión: 4.32
- Actualizado: 31 mayo 2019
- Activaciones: 8

El análisis de múltiples gráficos siempre ha sido uno de los mayores retos para los operadores profesionales. Sin embargo, esto puede superarse aumentando el número de monitores. Pero aquí le daremos una solución sencilla y rentable.
Una solución sencilla
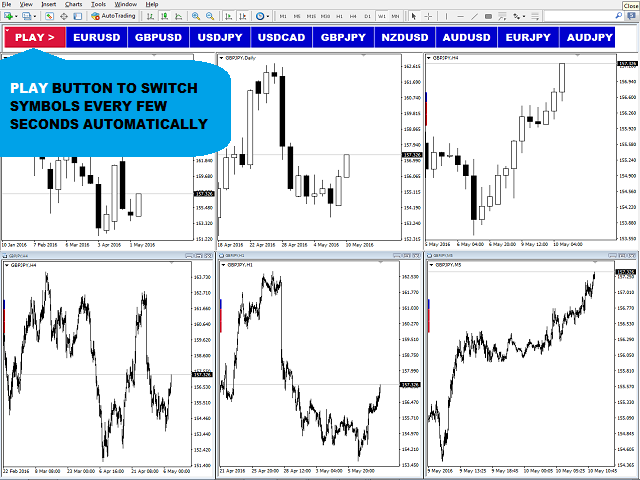
ISO Charts Organizer (Chart Clipper) le permite categorizar un gran número de gráficos abiertos sin tener que aumentar el número de monitores y acceder fácilmente a todos ellos de forma rápida o disfrutar de la función de cambio automático.
Todas las funciones que necesita
- Los gráficos se pueden categorizar por nombres de símbolos, plazos o cualquier otra combinación.
- Cambio automático de categorías.
- Grupos de gráficos ilimitados.
- Todos sus Expert Advisers e indicadores de alerta funcionarán correctamente en segundo plano.
- Diseñado para Tablet y PC.
Modo de empleo
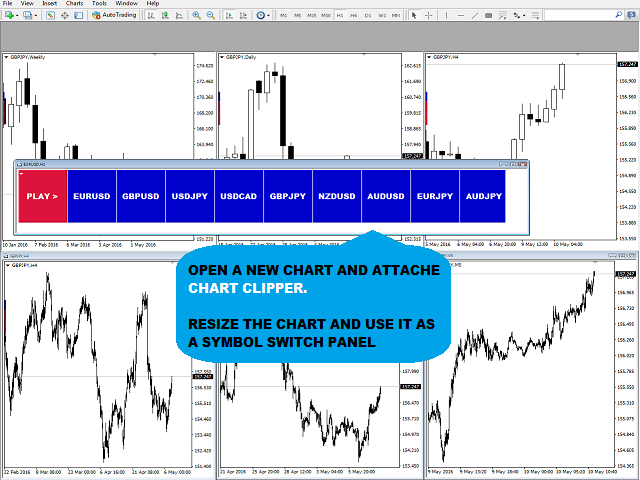
- Abra una nueva ventana de gráfico y añada ISO Chart Clipper.
- Cambie el tamaño de la ventana para obtener el mejor tamaño del botón del panel.
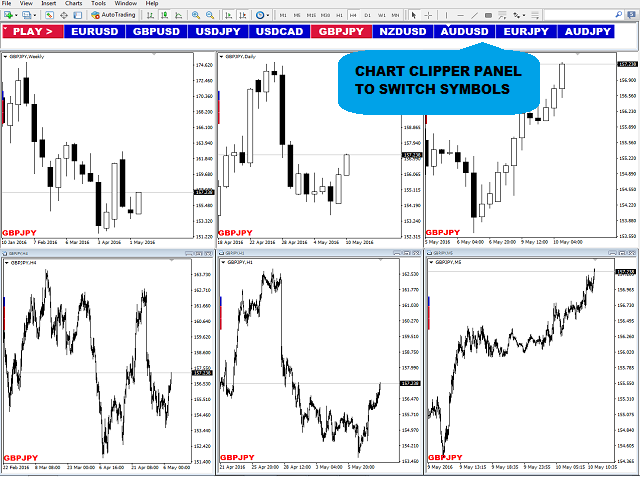
- Se colocará un botón editable en la parte inferior de todos los gráficos abiertos, que se rellenará con el nombre del símbolo por defecto. Puede ser reemplazado por cualquier nombre personalizado.
- Coloque todos los gráficos de cada grupo uno al lado del otro.
- Abra nuevos gráficos y repita los pasos 3 a 5 para crear un nuevo grupo.
Parámetros de configuración adicionales
- Mantener el panel siempre en la parte superior
- Color de fondo del panel principal
- Velocidad de actualización del panel en segundos
- Velocidad de reproducción automática en segundos
- Mostrar el nombre del símbolo en todos los gráficos
- Tamaño de fuente del nombre del símbolo en todos los gráficos
- Color del nombre del símbolo en todos los gráficos
- Ubicación del grupo de gráficos en todos los gráficos
Tenga en cuenta que se trata de un software gráfico con varios gráficos que no puede probarse como descarga de demostración.


This is one of those indicators that I spend years looking for and then finally find it!! Pretend it is a profile changer/manager without the pain of switching back and forth manually. You just click on a button to change these views.
You set up your charts the way you like it for a certain group, edit the bottom label and voila they are grouped together depending on the label you gave each chart!! You can then switch between these views immediately without setting anything else up as the indicator inserts the shortcuts automatically according to the name you labeled your groups. It is really that simple, amazing programming.
Of course there is a play slideshow option if you have simple indicators that you wish to view per symbol or per timeframes, but my indicators are a bit CPU heavy and there is a delay when playing, it is not Chart Clippers fault as it can't make your own indicators faster. I use it purely for switching manually between views.
It seems if you look at the screenshots that there is not enough space for many groups, believe me, there is plenty. If you resize the master legend, it automatically resizes the button sizes. However, I will suggest something in the comments section should a user have say 30 groups for whatever reason, I am sure that Payam will find a solution for it.
Well done!