MTF Support Resistance
- Indicadores
- Versión: 1.11
- Actualizado: 25 septiembre 2018
- Activaciones: 10

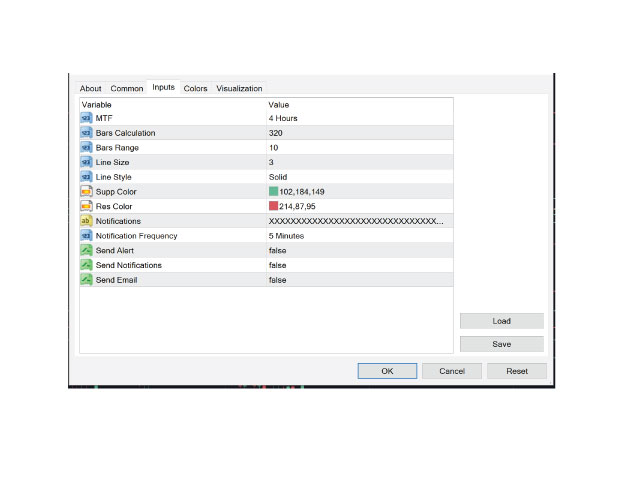
El indicador de soporte y resistencia MultiTimeframe (MTF) se utiliza para medir las últimas 320 barras (introducidas por el usuario) de soporte y resistencia del timeframe dedicado.
El usuario puede adjuntar este indicador a cualquier marco de tiempo que desee.
Características:
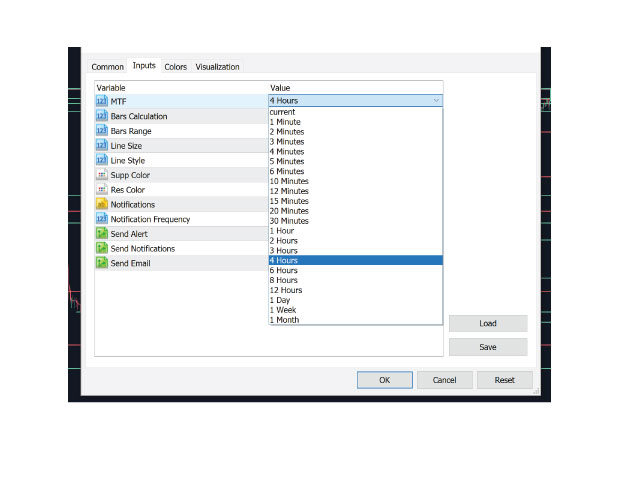
- El usuario ingresa el marco de tiempo deseado (por defecto Periodo H4)
- El usuario introduce el número de últimas barras (por defecto 320 barras)
- El usuario introduce la medida de las últimas HH y LL (por defecto 10 barras)
- Estilo y colores de las líneas.
Versión MT4 : https://www.mql5.com/en/market/product/31984