T3 Cloud MA
- Indicadores
- Versión: 1.0
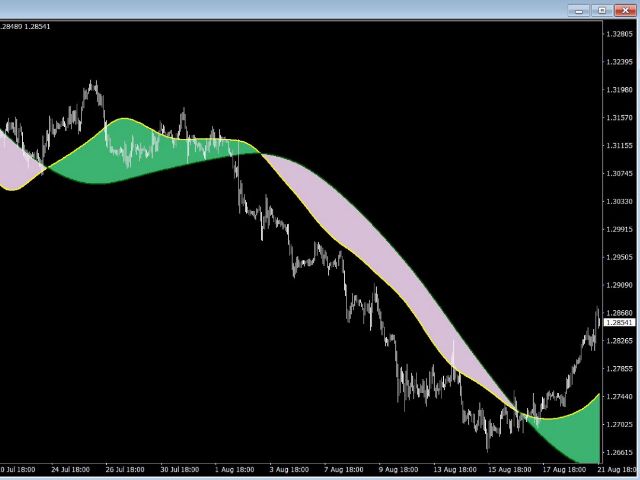
Indicador de tendencia derivado de las medias móviles T3. La nube está delimitada por las líneas T3 rápida y T3 lenta.
Oportunidades de compra/venta por encima/por debajo de la nube. Las líneas T3 MA rápida y lenta también pueden utilizarse como soporte/resistencia dinámica para entradas más agresivas.
Utilice los valores por defecto para los mejores ajustes. El número de barras de retrospectiva es definido por el usuario.
Este indicador se puede utilizar en combinación con otras estrategias, como la acción del precio.
Adecuado para todos los marcos de tiempo.
Requisitos previos: T3IndiSlow y T3IndiFast indicadores (por favor, descargue estos dos archivos de mi página de producto)