KFX Bulls and Bears
- Indicadores
- Versión: 1.0
- Activaciones: 5

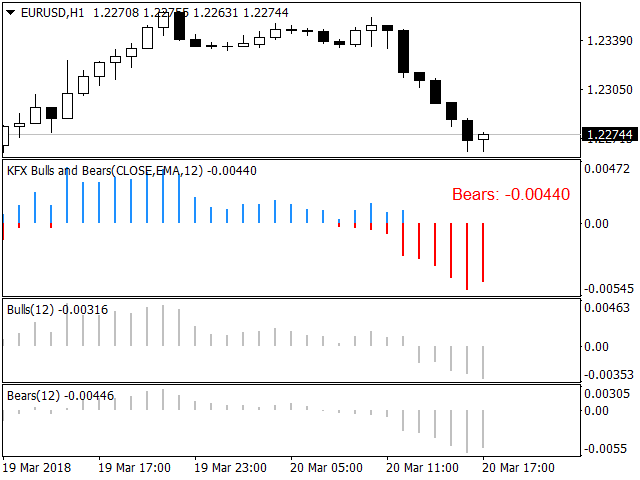
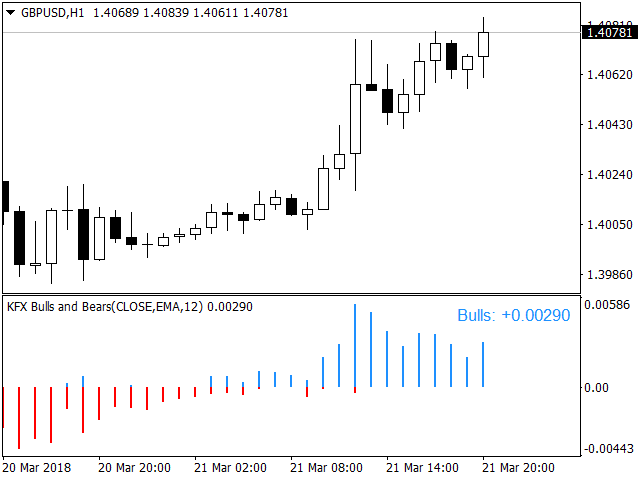
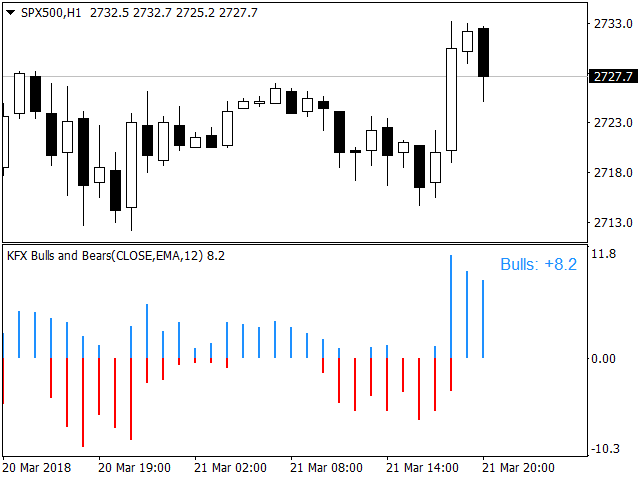
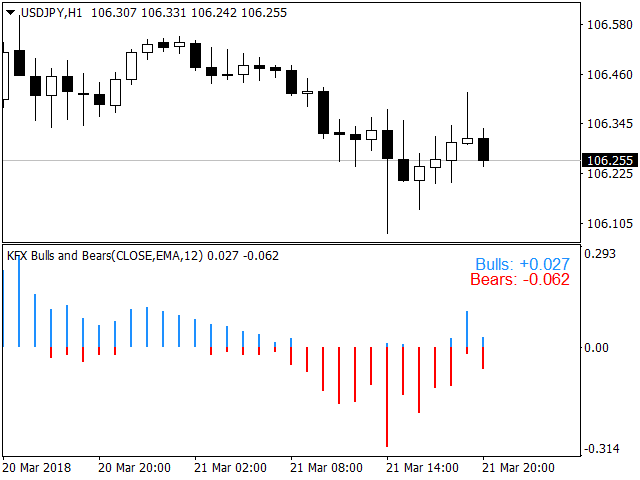
El indicador KFX Bulls and Bears consolida los indicadores de muestra Bulls y Bears Power en un solo indicador. Este indicador es una modificación de un conocido indicador Bulls/Bears power de Elder. Mide la distancia entre el precio extremo y los promedios móviles.
Parámetros
- Fuente - elija entre Cierre, Apertura, Máximo, Mínimo, Mediana, Precio Típico o Ponderado.
- Periodos - periodo para calcular las medias móviles.
- Tipo de MA - Seleccione entre Simple, Exponencial, Suavizada o Lineal Ponderada.
- Verbose - Permite la opción de mostrar los valores actuales de Bulls y Bears.
Definitely a must have in your trading