Actual Levels
- Indicadores
- Versión: 1.2
- Actualizado: 19 septiembre 2018
- Activaciones: 10

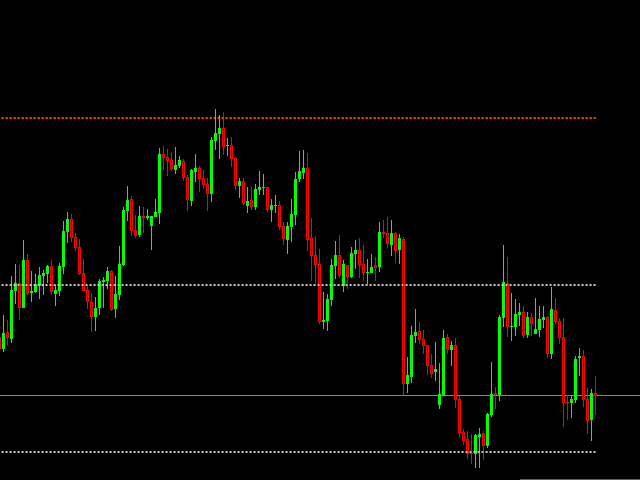
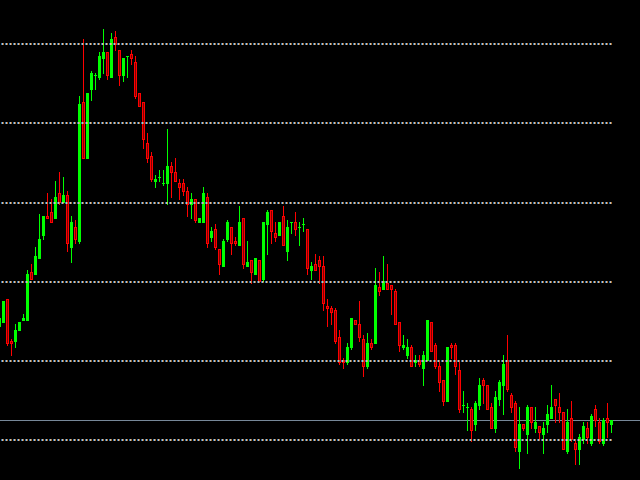
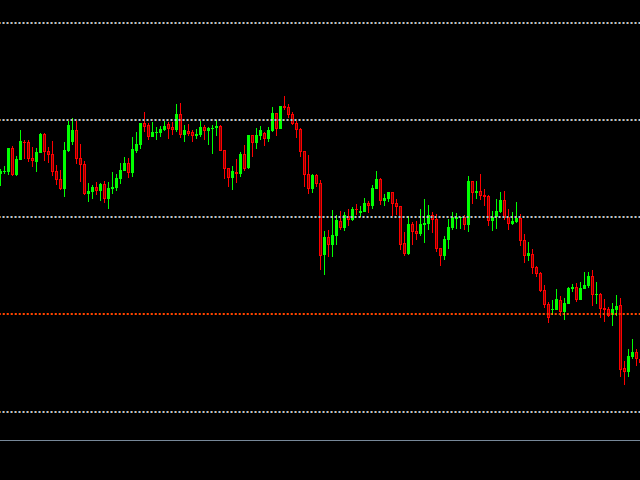
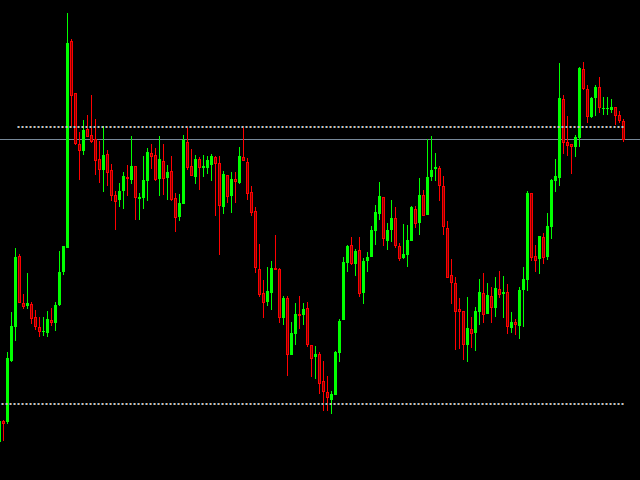
El indicador muestra importantes niveles de soporte y resistencia. Cuando el precio se acerca a estos niveles, de alguna manera responde a los niveles en sí, o a las áreas que están cerca de estos niveles.
Estos niveles pueden considerarse zonas potenciales de reversión. En consecuencia, los niveles pueden utilizarse para realizar operaciones de trading o para cerrar posiciones previamente abiertas.
Por ejemplo
Puede comprar si el precio retrocede desde el nivel de soporte hacia arriba, o vender si el precio retrocede desde el nivel de resistencia hacia abajo. También puede realizar operaciones de ruptura. Si se rompe el nivel de soporte (el precio está por debajo del nivel), puede vender. Por el contrario, si se rompe el nivel de resistencia (cuando el precio está por encima), puede comprar esperando que el precio suba hasta el siguiente nivel de resistencia.
Parámetros del indicador
- Período - período de cálculo del indicador para trazar los niveles
- Barras - el número de barras en las que se muestra el indicador
- Niveles normales - el color de los niveles normales
- Niveles fuertes - el color de los niveles fuertes

Great indicator. Personally I use it for binary options on the 5 minute time frame.
I have a request ... On the next update insert the possibility of having the dots or the classic line.