Dual Momentum
- Indicadores
-
Adolfina Denysenko
 Welcome! I'm Adelina, a trader and strategy author on MQL5. I use a combination of technical analysis, algorithmic solutions, and strict risk management in my approach. Here, you will find my transparent and efficient trading signals, advisors, and indicators. I believe in a systematic approach
 - Versión: 1.1
- Actualizado: 6 octubre 2025
- Activaciones: 10
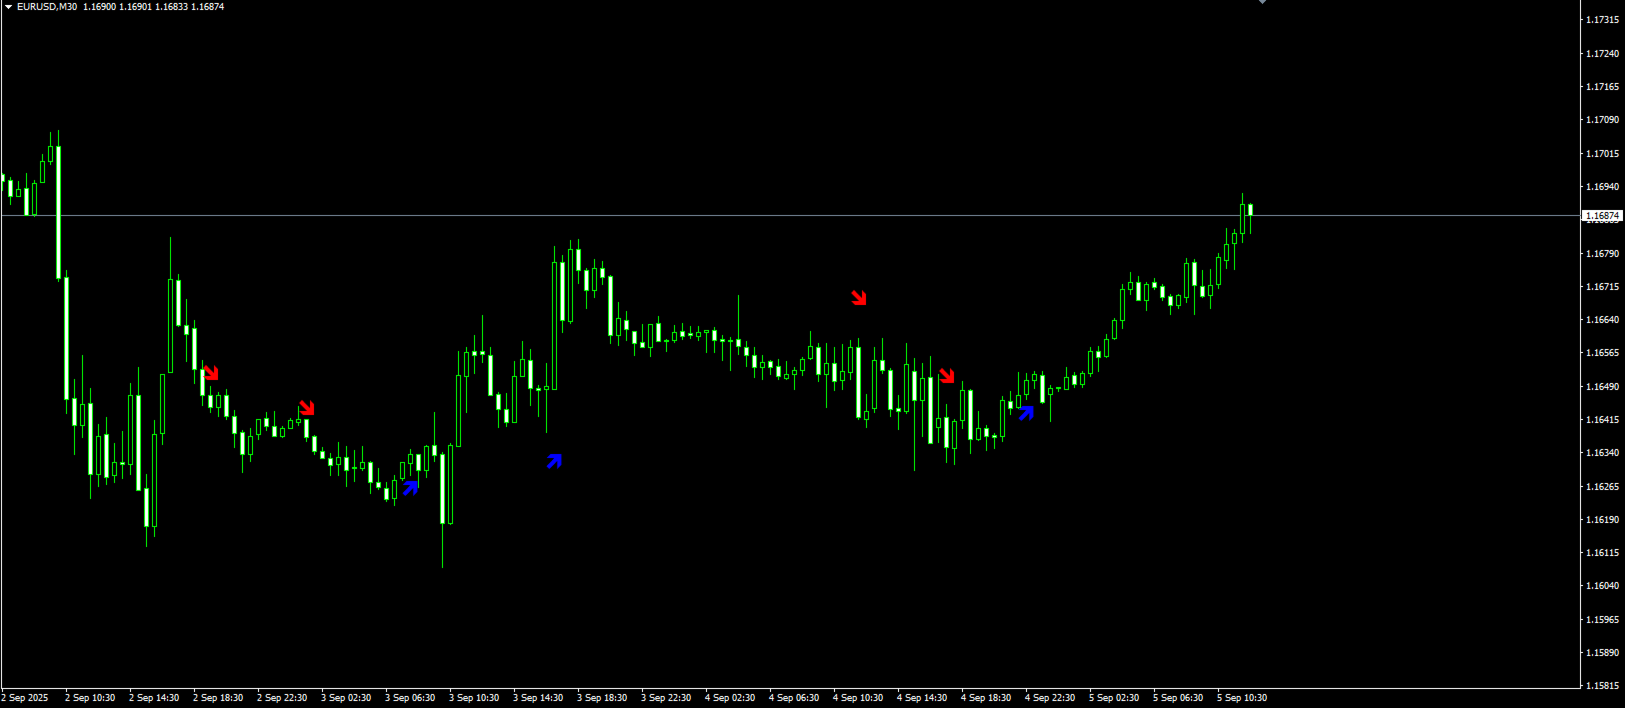
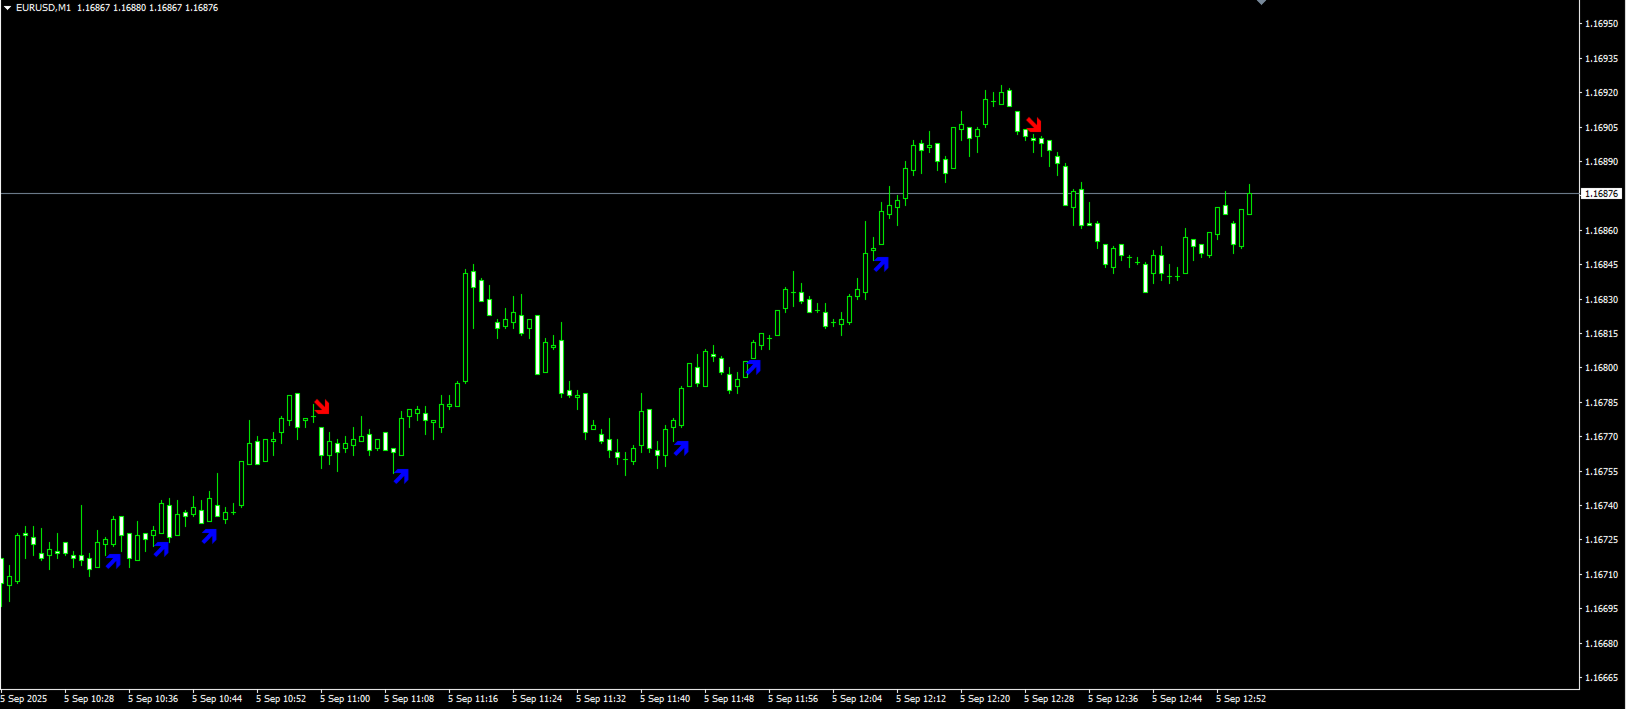
Dual Momentum es un moderno indicador de flecha para MetaTrader 4, creado específicamente para la detección precisa de los retrocesos del mercado y los movimientos de impulso fuerte.
🔹 El indicador se basa en una combinación de dos potentes osciladores - Williams %R y RSI, que le permite filtrar el ruido y generar señales más fiables. Gracias a esto, Dual Momentum indica sólo los puntos de entrada clave cuando la probabilidad de una operación exitosa es más alta.
⚡ Principales ventajas:
Sin redibujado - las señales permanecen en el gráfico y no desaparecen tras el cierre de la vela.
Dos niveles de filtrado - los ajustes incorporados le permiten cortar los falsos impulsos y aumentar la precisión de las señales.
Fácil de usar - adecuado tanto para principiantes como para profesionales.
Flexibilidad - funciona en cualquier par de divisas, plazos e incluso con índices/metales.
Visualización vívida - flechas con una visualización clara en el gráfico son fácilmente visibles incluso durante el comercio activo.
Cómo funciona:
Las flechas azules (compra) aparecen al final de la corrección y el comienzo de un impulso alcista.
Las flechas rojas (venta) señalan el final de un retroceso y el comienzo de un movimiento bajista.
Para aumentar la fiabilidad, el indicador utiliza filtros incorporados para cortar las fluctuaciones débiles del mercado.
Dónde se puede utilizar:
Para operaciones intradía (M5-M30).
Para operaciones a medio plazo (H1-H4).
En condiciones de tendencia y planas, las señales siguen siendo precisas gracias al filtrado.
Adecuado para Forex, criptodivisas, CFD y metales.
🛠 Ajustes:
Period - periodo de cálculo del indicador (óptimo de 7 a 14).
Filter_by y Filter_sel - filtros incorporados para la personalización flexible a su estrategia.
✅ Resumen:
Dual Momentum no es sólo una flecha, sino una herramienta de pleno derecho que ayudará a un comerciante:
entrar en el mercado a tiempo,
reducir el número de entradas falsas,
aumentar la eficacia de su estrategia.
Si usted está buscando un indicador fiable para la entrada y salida precisa, entonces Dual Momentum se convertirá en su asistente universal.