Dual Momentum

  • 指标
  • Adolfina Denysenko
    Adolfina Denysenko
    Welcome! I'm Adelina, a trader and strategy author on MQL5. I use a combination of technical analysis, algorithmic solutions, and strict risk management in my approach. Here, you will find my transparent and efficient trading signals, advisors, and indicators. I believe in a systematic approach
  • 版本: 1.1
  • 更新: 6 十月 2025
  • 激活: 10
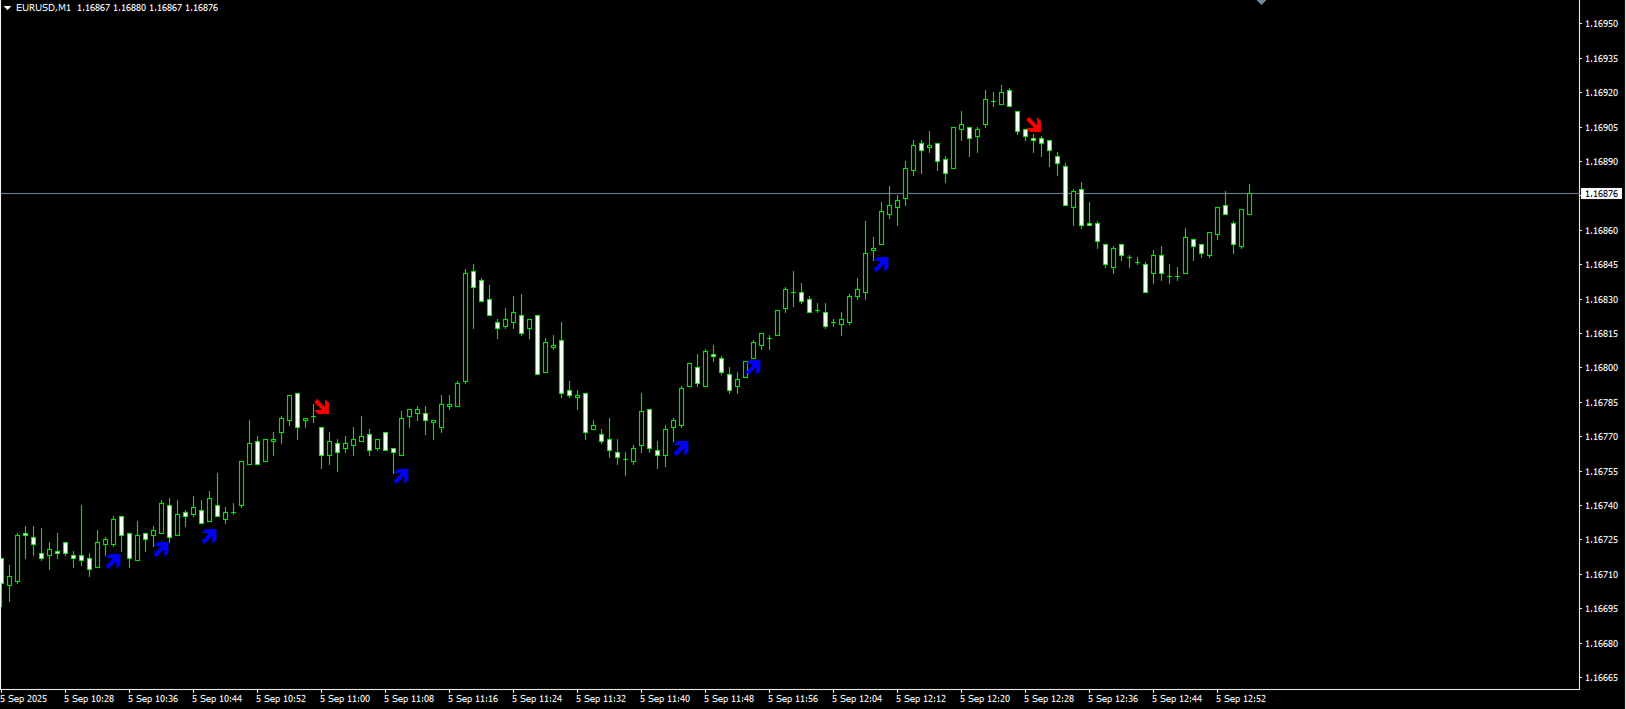
Dual Momentum is a modern arrow indicator for MetaTrader 4, created specifically for the accurate detection of market reversals and strong impulse movements.

🔹 The indicator is based on a combination of two powerful oscillators – Williams %R and RSI, which allows you to filter noise and generate more reliable signals. Thanks to this, Dual Momentum indicates only key entry points when the probability of a successful trade is highest.

⚡ Key advantages:

No redrawing – signals remain on the chart and do not disappear after the candle closes.

Two levels of filtration – built-in settings allow you to cut off false impulses and increase the accuracy of signals.

Easy to use – suitable for both beginners and professionals.

Flexibility – works on any currency pairs, timeframes and even with indices/metals.

Vivid visualization – arrows with a clear display on the chart are easily visible even during active trading.

📊 How it works:

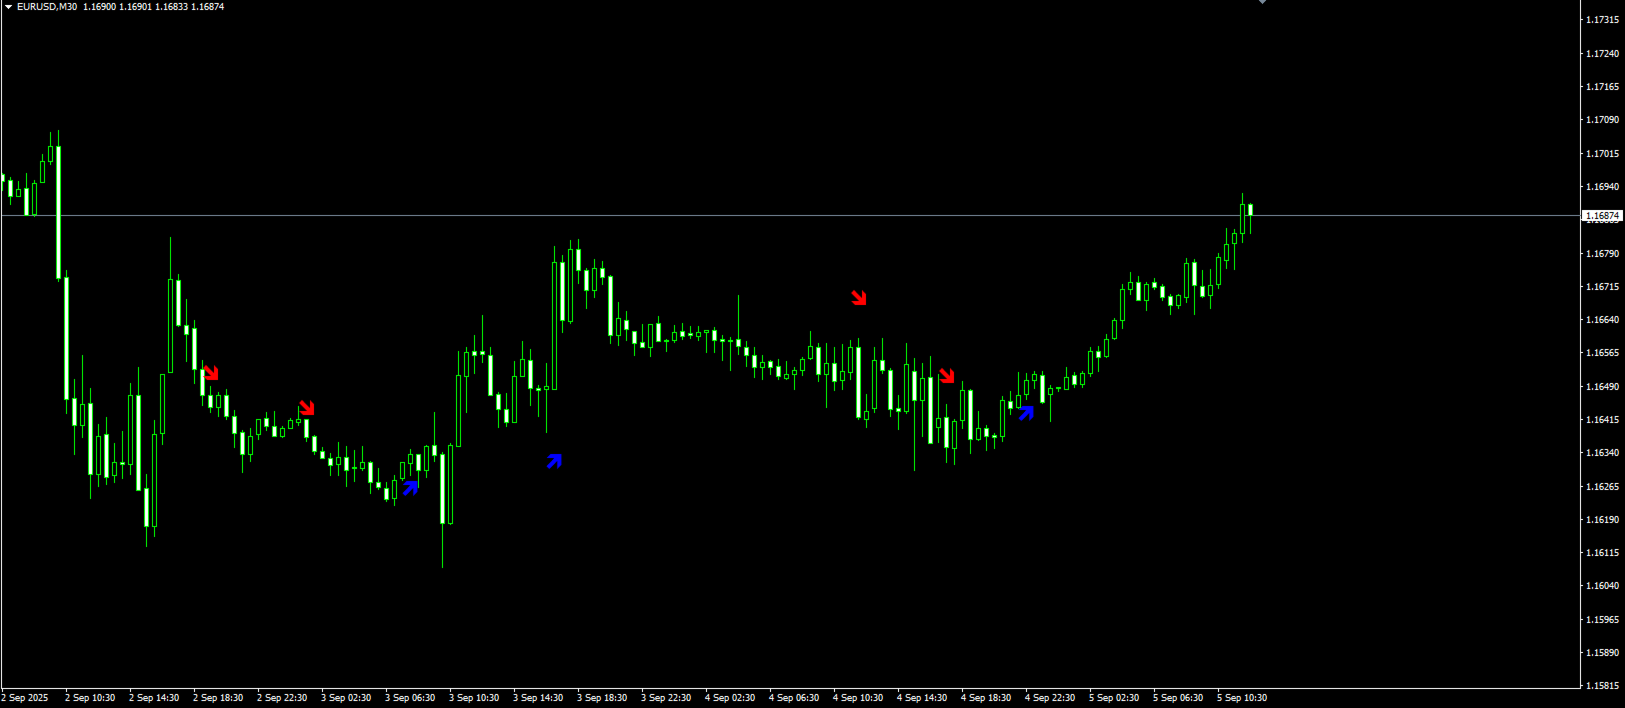
Blue arrows (buy) appear at the end of the correction and the beginning of an upward impulse.

Red arrows (sell) signal the end of a rollback and the beginning of a downward movement.

To increase reliability, the indicator uses built-in filters to cut off weak market fluctuations.

🎯 Where it can be used:

For intraday trading (M5–M30).

For medium-term trading (H1–H4).

In trend and flat conditions, signals remain accurate due to filtering.

Suitable for Forex, cryptocurrencies, CFDs and metals.

🛠 Settings:

Period – indicator calculation period (optimally from 7 to 14).

Filter_by and Filter_sel – built-in filters for flexible customization to your strategy.

✅ Summary:

Dual Momentum is not just an arrow, but a full-fledged tool that will help a trader:

enter the market on time,

reduce the number of false entries,

increase the effectiveness of your strategy.

If you are looking for a reliable indicator for accurate entry and exit, then Dual Momentum will become your universal assistant. 
推荐产品
Towers
Yvan Musatov
Towers - Trend indicator, shows signals, can be used with optimal risk ratio. It uses reliable algorithms in its calculations. Shows favorable moments for entering the market with arrows, that is, using the indicator is quite simple. It combines several filters to display market entry arrows on the chart. Given this circumstance, a speculator can study the history of the instrument's signals and evaluate its effectiveness. As you can see, trading with such an indicator is easy. I waited for an a
BinaryIndicator
Andrey Spiridonov
BinaryIndicator is a highly accurate indicator for trading binary options. It shows excellent results in scalping. This indicator is based in multifactor analysis of trend indicators, as well as confirmation oscillators, which in the end gives an increased accuracy of signals. Advantages of the indicator Increased accuracy of signals. Excellent results when trading binary options with a short expiration time from M30 to M1 . It works on any timeframes. Works with any trade symbols. Parameters
CVD背離偵測 - 先進成交量能差分析   我們解決的問題 大多數交易者僅依賴價格走勢,錯過了揭示真實市場情緒的關鍵成交量流向信息。傳統指標滯後於價格變動,導致進場過晚和風險管理不佳。 CVD背離偵測 通過分析價格與成交量差動量之間的關係來解決這個問題,在重大市場變動之前為您提供早期預警信號。   CVD背離分析的優勢   早期市場逆轉偵測   - 在價格圖表出現之前發現動量轉變   智能資金追蹤   - 觀察機構何時累積或分配   減少虛假信號   - 成交量確認價格走勢,提供更高概率設置   多時間框架優勢   - 適用於所有時間框架,從剝頭皮到波段交易   通用應用   - 兼容外匯、股票、商品和加密貨幣   4個市場階段 - 真實交易故事 設想EUR/USD接近重要支撐位...   階段1:初始下跌(CVD在零線上方下跌) 價格從阻力位開始下跌 CVD信號下跌但保持在零線上方 解讀:   賣壓增強,但買方仍然存在   階段2:加速賣出(CVD跌破零線以下) 價格繼續向支撐位下跌 CVD信號跌破零線 解讀:   賣方佔主導,動量
BinaryScalping
Andrey Spiridonov
BinaryScalping is a professional indicator for trading binary options and scalping. The algorithm of the indicator is based on the calculation of pivot points for each time period separately, the location of the price of the trading instrument relative to the pivot points is analyzed and the probability of a trading operation is calculated. The indicator has a built-in filter of trading signals based on the global trend. The indicator is installed in the usual way and works with any trading inst
This indicator is designed for scalping on low timeframes (M1-M15) in volatile markets like major forex pairs (e.g., EURUSD, GBPUSD). It generates non-repainting buy (green up arrow) and sell (red down arrow) signals based on EMA crossover confirmed by RSI momentum and MACD crossovers, minimizing false signals in ranging markets. How to Use: Attach the indicator to your MT4 chart. Look for arrows on the chart: Buy on green up arrow, Sell on red down arrow. Signals appear at the open of the new
User Manual Download link: https://ontrd.com/our-books/ For all who are asking about indicator  ON Trade Numerology Station It obtain about 16 numerology strategies it make together completed unit control your trading . Basic strategies to work with it are 3 strategies statistics about them are the following : 1. RBA levels success rate more then 95%. 2. FF more then 96%  3.RBA SUN 98% We will not say 100 % as they are .. Ratio rates as following :  1.Rba levels more then 1/3 to 1/6 . 2.FF MORE
Manuscript mt4
Artur Razhabov
Manuscript is a time-tested indicator, many tests have been conducted in its use, I will tell all buyers my recommendations on using forex, cryptocurrency or binary options This indicator gives a signal exactly at the close of the candle of the selected period The arrow does not disappear after the signal, you can set up email notifications I recommend using it on the period H1,H4,daily If you are aware of its work, you will be able to trade in a plus In the future I will give you my recomm
Reversal Edge System是一款专为MetaTrader 4打造的专业顶底工具指标。它识别潜在趋势信号区域,输出清晰的交易信号,并通过多周期趋势分析做信号滤波,简化想象交易形态。 指标实时展现市场情绪:强烈看多强烈看空偏多偏空多空闭合 每个信号都涉及预设止盈(TP)与止损(SL)价位,做好风险管理。指标内置信号回测功能,统计核心数据:胜率、信号总数,交易者可以直接在图表上可视化评估历史表现。 核心功能: 顶底信号 多周期(MTF)趋势确认过滤器 实时市场情绪标签 每个信号自带止盈与止损 信号回测模拟 胜率与信号总数统计 支持外汇、加密货币、指数与商品 无重绘提示 借助可验证的食谱格局与内置风控,更智能地交易,获得您的交易优势。
NostradamusMT4
Andrey Spiridonov
1 (1)
NostradamusMT4 is a powerful indicator from the set of professional trader. The indicator is based on Andrei Spiridonov's original price calculation method (ESTIMATED PRICE) for the current candle price. Advantages The indicator does not redraw. It works on any timeframes. Works with any trading instruments. Perfectly suitable for scalping and trading binary options. Parameters Color - color of the ESTIMATED PRICE FUTURE line. How to work with the indicator The indicator forms the ESTIMATED P
VR Cub
Vladimir Pastushak
VR Cub 这是获得高质量切入点的指标。该指标的开发是为了促进数学计算并简化对仓位入场点的搜索。多年来,该指标所针对的交易策略已被证明其有效性。交易策略的简单性是其巨大的优势,即使是新手交易者也能成功进行交易。 VR Cub 计算开仓点以及获利和止损目标水平,这显着提高了效率和易用性。查看使用以下策略进行交易的屏幕截图,了解简单的交易规则。 设置、设置文件、演示版本、说明、问题解决,可以从以下位置获取 [博客] 您可以在以下位置阅读或撰写评论 [关联] 版本为 [MetaTrader 5] 计算入场点的规则 开仓 要计算入场点,您需要将 VR Cub 工具从最后一个高点拉伸到最后一个低点。 如果第一个点在时间上早于第二个点,交易者等待柱线收于中线上方。 如果第一个点在时间上晚于第二个点,交易者等待柱线收于中线下方。 根据上述条件,严格在 柱线收盘 后建仓。 换句话说,如果我们在小时图上进行交易,那么从最高点到最低点的时间距离必须超过24小时,最高点和最低点之间的点数必须大于或等于平均价格变动每天。 维持和改变市场地位 可以有多个未平仓头寸;每个头寸都可以单独修改。 VR Cub
PABT Pattern Indicator - it's classical system one of the signal patterns. Indicator logic - the Hi & Lo of the bar is fully within the range of the preceding bar, look to trade them as pullback in trend. In the way if indicator found PABT pattern it's drawing two lines and arrow what showing trend way.  - First line - it's entry point and drawing at: 1. On the high of signal bar or on middle of the signal bar (depending from indicator mode) for buy; 2. On the low of signal bar or on middle of t
BinaryUniversal
Andrey Spiridonov
BinaryUniversal is a signal indicator for binary options and Forex. In its work, the indicator uses a complex algorithm for generating signals. Before forming a signal, the indicator analyzes volatility, candlestick patterns, important support and resistance levels. The indicator has the ability to adjust the accuracy of the signals, which makes it possible to apply this indicator for both aggressive and conservative trading. The indicator is set in the usual way, it works on any time period and
Alpha Trend sign Alpha Trend sign 是我么长期以来非常受欢迎的交易工具,它可以验证我们的交易系统,并且明确的提示交易信号,并且信号不会漂移。 主要功能: •  根据市场显示活跃区域,根据指标可以很直观的判断当前行情是属于趋势行情,还是震荡行情。    并根据指标的指示箭头切入市场,绿色箭头提示买入,红色箭头提示卖出。 •  建议使用5分钟以上的时间周期进行交易,避免因为小周期波动出现频繁的交易信号。 •  您也可以开启信号提示,以免错过最佳的交易时机。 •  本指标不但可以很好的预测趋势行情,也可以在宽幅震荡行情中获利。 •  本指标本着大道至简的原则,适合不同阶段的交易者使用。 注意事项: •  Alpha Trend sign 有明确的进出场信号,不建议逆势操作,以免造成损失。 •  Alpha Trend sign 是特别成熟的指标,我们团队人手一个,使用它可以实现稳定盈利。     
The indicator of a Professional Trader is an arrow indicator for predicting the direction of price movement. I have been working on this indicator since 2014. You can use this indicator as your main indicator, use its entry signals, and use it as your only indicator to find entry points. About the product: Recommended TF [H4-D1-W1]   . The indicator predicts the direction of the next candle. Fits a variety of tools; Flexibility in settings for different instruments and intervals through the MO
本指标把成交量柱改用颜色渐变绘制,而不是单一颜色,这样一眼就能分辨出哪些 K 线的成交量强、哪些弱。 每根 K 线的成交量都会与你设定的回顾周期内的平均成交量做比较:高于均值越多,颜色越深;接近或低于均值则用浅色。色调跟随 K 线涨跌方向,上涨 K 线的成交量和下跌 K 线的成交量用不同颜色,买卖双方力量对比逐根可见。 关于 MT4 成交量的说明:MT4 不提供交易所成交量,本指标读取的是 tick volume,即一根 K 线内的报价更新次数。tick volume 随经纪商而异,不同经纪商之间数值不可比,没有成交量数据的品种则无显示。 如何看图 - 浅色:成交量接近或低于均值,参与度低 - 深色:成交量明显高于均值,参与度高 - 色调:显示成交量来自上涨 K 线还是下跌 K 线 常见用法 - 趋势确认:价格上涨且颜色加深,说明上涨有量能支撑;价格上涨但颜色变浅,说明推动力量不足 - 背离提示:价格创新高而颜色变浅,或价格创新低而颜色加深,提示原有走势的支撑在减弱 - 突破过滤:放量突破比缩量突破更可能延续 - 放量提醒:成交量超过均值指定倍数时可发出提醒 输入参数
WanaScalper MT4
Isaac Wanasolo
1 (1)
A scalping indicator based on mathematical patterns, which on average gives signals with relatively small SL, and also occasionally helps to catch big moves in the markets (more information in the video) This indicator has three main types of notifications: The first type warns of a possible/upcoming signal on the next bar The second type indicates the presence of a ready signal to enter the market/open a position The third type is for SL and TP levels - you will be notified every time price re
Smart Reversal Signal
Evgeny Belyaev
3 (2)
Smart Reversal Signal  is a professional indicator for the MetaTrader 4 platform; it has been developed by a group of professional traders. This indicator is designed for Forex and binary options trading. By purchasing this indicator, you will receive: Excellent indicator signals. Free product support. Regular updates. Various notification options: alert, push, emails. You can use it on any financial instrument (Forex, CFD, options) and timeframe. Indicator Parameters Perod - indicator calculat
Insider Scalper Binary This tool is designed to trade binary options. for short temporary spends. to make a deal is worth the moment of receiving the signal and only 1 candle if it is m1 then only for a minute and so in accordance with the timeframe. for better results, you need to select well-volatile charts.... recommended currency pairs eur | usd, usd | jpy .... the indicator is already configured, you just have to add it to the chart and trade .... The indicator signals the next candle.
AutoPivot FXAIEA —— 一眼看清当天支撑阻力的枢轴点指标 做日内交易,最耗神的不是找形态,而是回答一个最基础的问题: 今天价格在什么位置会受阻、在哪里有支撑、哪条线才是真正的关键位。 AutoPivot FXAIEA 把这件事变成了看图就能答:每一天自动画出枢轴中轴 P 与上下各四层阻力 R1–R4、支撑 S1–S4,价格走到哪一层、离哪条线还有多少空间,抬眼就知道。 用它看盘,你能直接得到什么 一眼分清"现在处在什么位置" 中轴 P 就是当天多空的分水岭。价格在 P 上方,说明买方占优,回踩 P 不破就是顺势做多的位置;跌回 P 下方,说明卖方接管,反抽 P 站不上去就是空的思路。不用再自己翻昨天的开高低去算。 提前知道下一目标位在哪 价格突破 R1,下一个目标就是 R2,再上是 R3——每一层的距离在图上是等距展开的,推进节奏一目了然。做突破单时,止盈放在哪一层、还剩多少空间,事前就能算清楚,不用边走边猜。 支撑阻力变成明确的进出场依据 回踩 S1 企稳可考虑接多,跌破 S1 就看 S2;反弹到 R1 滞涨可考虑减仓,站稳 R1 再追 R2。每条线都有实际意义,止损
Trendiness Index
Libertas LLC
5 (3)
"The trend is your friend" is one of the best known sayings in investing, because capturing large trendy price movements can be extremely profitable. However, trading with the trend is often easier said than done, because many indicators are based on price reversals not trends. These aren't very effective at identifying trendy periods, or predicting whether trends will continue. We developed the Trendiness Index to help address this problem by indicating the strength and direction of price trend
G2 Signal Indicator
Ida Bagus Putu Mahardika
G2 SIGNAL INDICATOR by Ida Bagus Putu Mahardika STRATEGY DESCRIPTION The EA G2 Signal Indicator is an advanced multi-timeframe system that combines 3 layers of analysis to generate high-quality entry signals with exceptional accuracy. Developed with a professional approach, this indicator is designed for traders seeking a competitive edge in the forex market. STRATEGY ADVANTAGES 1. 3-LAYER MULTI-TIMEFRAME SYSTEM Layer 1 (M15):   Market Structure Filtering identifies the primary trend using
FREE
Smoothed Average K Line FX-AIEA —— 双层复合平滑趋势动能分析指标(算法与参数讨论) 概述 本指标基于双层复合平滑架构,对价格的开、高、低、收四个维度进行动态降噪与结构重构,生成标准化动能直方图。细柱响应短线动能脉冲,粗柱确认波段级趋势方向,两者同步共振时信号可信度显著提升。 核心算法特点 双通道动能映射 :采用双重平滑引擎,快速与慢速柱体并行计算,辅助识别动能爆发与结构背离。 智能降噪机制 :通过多层自适应滤波算法动态过滤高波动环境下的随机噪声,旨在提高信号纯净度。 参数配置 :支持两组独立参数配置(算法与周期),可适配从 M1 至 H4 的多周期场景,适用于外汇、贵金属、指数、能源等主流品种。 兼容性 :完全遵循 MQL5 标准指标接口,可与 EA 及其他指标集成。 通用参数配置说明(参考同类平滑 K 线指标) 参数 类型 默认值 说明 移动均线周期 int 14 指定计算移动平均的周期   移动均线类型 enum SMA 简单移动平均(SMA)、指数平滑(EMA)、平滑移动平均(SMMA)或线性加权(LWMA)   过滤器(价格) double
Next level of trend trading here. Possibility 75%, the indicator analyzes the current market to determine short (small dot), middle (circle with a dot inside) and long (cross with a circle and a dot inside) trends.  Wingdings characters of  Aqua color represents the beginning of the UP trend. Wingdings characters of  Orange color represents the beginning of the DOWN trend. Possibility 75% Indicator will improve your trading in the world of forex, commodities, cryptocurrencies and indices.
Signal From Level
Yaroslav Varankin
Binary Options Support Resistance Indicator This indicator is designed for binary options trading and effectively shows retracements from support and resistance levels. Signals appear on the current candle. A red arrow pointing downwards indicates a potential selling opportunity, while a blue arrow pointing upwards suggests buying opportunities. All that needs adjustment is the color of the signal arrows. It is recommended to use it on the M1-M5 timeframes as signals are frequent on these timef
Sharp Scalper
Mazin Salim Said Ba Abbad
The “Sharp Scalper” indicator is high-frequency trading tool designed for quick, short term trades in the forex market. It focus on identifying rapid price movement and generating signals for best entry. This indicator is known for its ability to capture small profit opportunities multiple times throughout the day making it ideal for scalpers looking to capitalize on market volatility. The” sharp scalper” indicator employs advance algorithms to detect market trends and fluctuation, helping trade
Introduction It is common practice for professional trades to hide their stop loss / take profit from their brokers. Either from keeping their strategy to the themselves or from the fear that their broker works against them. Using this indicator, the stop loss / take profit points will be drawn on the product chart using the bid price. So, you can see exactly when the price is hit and close it manually.  Usage Once attached to the chart, the indicator scans the open orders to attach lines for t
Volume Channel Flow Indicator MT4 Dynamic Channel Breakout Indicator for MetaTrader 4 Volume Channel Flow Indicator is a professional technical analysis indicator for MetaTrader 4 , designed to identify potential trend changes and breakout opportunities using a dynamic price channel calculated with ATR-based channel width . The indicator analyzes confirmed market candles and automatically builds a dynamic channel around price. When price closes beyond the channel, the indicator identifies a pote
Quantum Regime Indicator
Gideon Asiamah Yeboah
Product Name:   Quantum Regime Indicator Short Description:   A multi-engine structural regime and volatility filter. Description: Quantum Regime Indicator (QRI) is a sophisticated technical analysis algorithm designed to identify market structure shifts and volatility regimes. Unlike standard indicators that rely on immediate price action, QRI utilizes a hierarchical logic architecture to filter market noise and identify statistical extremes. The indicator is built on the philosophy of "Market
This is an arrow indicator without a future function,developed based on the most advanced profit trading algorithms.It has the most innovative and advanced dual trend analysis module, as well as the latest and highly effective market trend prediction algorithm.Trends are your friends, and following larger trends can earn the maximum profit in foreign exchange. This indicator helps traders identify current trends and track them. Someone once made a profit of 10 times in a week by relying on it.No
Dear traders this is Our new Indicator called Hull Pro MTF Indicator — Precision Multi-Timeframe Trend Visualizer Overview The Hull Pro MTF Indicator is a next-generation Heiken-Ashi-based multi-timeframe visual tool designed for top-down market analysis . It blends the power of Hull Moving Average (HMA) logic and multi-level Heiken-Ashi smoothing to reveal directional bias, volatility ranges, and price symmetry across hourly, daily, weekly, monthly, and yearly structures — all in a single c
该产品的买家也购买
Miraculous Indicator Binary & Forex v3 StrategySafe Miraculous Indicator Binary & Forex v3 StrategySafe 是一款专业交易指标,适合希望获得清晰信号、强大确认工具以及结构化交易方式的 Binary 和 Forex 交易者。 v3 版本加入了 MIR Dashboard、Miraculous Confirmation Dashboard、GANN Law、Square of 9 水平线、GANN 角度以及更强的 Forex 分析模式。 核心功能 同时支持 Binary 和 Forex 交易模式。 MIR Dashboard 可快速读取市场状态。 Miraculous Confirmation Dashboard 用于确认交易机会。 GANN Law drawing lines 用于 Forex 市场结构分析。 Square of 9 线条、方向和关键价格水平。 1x1 GANN Angle 用于判断趋势压力。 Entry Information TP 帮助寻找合理止盈区域。 Strateg
FFx Engulfing Setup Alerter gives trade suggestions with Entry, Target 1, Target 2 and StopLoss. Below are the different options available: Entry suggestion - pips to be added over the break for the entry 3 different options to calculate the SL - by pips, by ATR multiplier or at the pattern High/Low 3 different options to calculate the 2 TPs - by pips, by ATR multiplier or at Risk/Reward Offset the dashboard - any place on the chart Remove the suggestion once the price reached the SL line Lines
FFx InsideBar Setup Alerter gives trade suggestions with Entry, Target 1, Target 2 and StopLoss. Below are the different options available: Entry suggestion - pips to be added over the break for the entry Minimum candle size - to avoid too close buy/sell entry suggestions 3 different options to calculate the SL - by pips, by ATR multiplier or at the pattern High/Low 3 different options to calculate the 2 TPs - by pips, by ATR multiplier or at Risk/Reward Offset the dashboard - any place on the c
FFx OutsideBar Setup Alerter gives trade suggestions with Entry, Target 1, Target 2 and StopLoss. Below are the different options available: Entry suggestion - pips to be added over the break for the entry. 3 different options to calculate the SL - by pips, by ATR multiplier or at the pattern High/Low. 3 different options to calculate the 2 TPs - by pips, by ATR multiplier or at Risk/Reward. Offset the dashboard - any place on the chart. Remove the suggestion once the price reached the SL line.
FFx PinBar Setup Alerter gives trade suggestions with Entry, Target 1, Target 2 and StopLoss. Below are the different options available: Entry suggestion - pips to be added over the break for the entry Minimum candle size - to avoid too small candles 3 different options to calculate the SL - by pips, by ATR multiplier or at the pattern High/Low 3 different options to calculate the 2 TPs - by pips, by ATR multiplier or at Risk/Reward Offset the dashboard - any place on the chart Remove the sugges
Lineverse Trendlines
Arkady Segal
5 (1)
Automatic, live & interactive picture of all trendlines. Assign push, email and sound alerts to the lines of your choice and be informed about price rollback, breakout, rollback after breakout, number of rollbacks, line expiration by double breakout. Correct, drag or delete the lines and interactively tune the line system. https://youtu.be/EJUo9pYiHFA . Chart examples https: //www.mql5.com/en/users/efficientforex Price Interaction Events All events are effective immediately and only after one
FFx MACD Divergences
Eric Venturi-Bloxs
The purpose of this new version of the MT4 standard indicator provided in your platform is to display in a sub-window multiple timeframes of the same indicator with its divergences. See the example shown in the picture below. But the display isn't like a simple MTF indicator. This is the real display of the indicator on its timeframe. Here's the options available in the FFx divergences indicator: Select the timeframes to be displayed (M1 to Monthly) Define the width (number of bars) for each tim
FFx RSI Divergences
Eric Venturi-Bloxs
The purpose of this new version of the MT4 standard indicator provided in your platform is to display in a sub-window multiple timeframes of the same indicator with its divergences. See the example shown in the picture below. But the display isn't like a simple MTF indicator. This is the real display of the indicator on its timeframe. Here's the options available in the FFx divergences indicator: Select the timeframes to be displayed (M1 to Monthly) Define the width (number of bars) for each tim
FFx CCI Divergences
Eric Venturi-Bloxs
The purpose of this new version of the MT4 standard indicator provided in your platform is to display in a sub-window multiple timeframes of the same indicator with its divergences. See the example shown in the picture below. But the display isn't like a simple MTF indicator. This is the real display of the indicator on its timeframe. Here's the options available in the FFx divergences indicator: Select the timeframes to be displayed (M1 to Monthly). Define the width (number of bars) for each ti
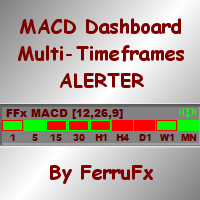
The FFx Dashboard MTF alerter will show you on a single chart all the timeframes (M1 to Monthly) with their own status for the indicator. 2 Alert Options: Single timeframe: each selected timeframe alert separately when a signal occurs Multi timeframes: all selected timeframes must agree for an alert to be triggered Both options have an input to select the timeframes to be used for the alert(s). How to Understand the Status: Green/Red square: histogram above/below 0 line Green square + Red bord
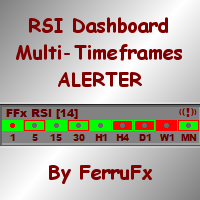
The FFx Dashboard MTF alerter will show you on a single chart all the timeframes (M1 to Monthly) with their own status for the indicator. 2 Alert Options: Single timeframe: each selected timeframe alert separately when a signal occurs Multi timeframes: all selected timeframes must agree for an alert to be triggered Both options have an input to select the timeframes to be used for the alert(s). How to understand the status: Green/Red square: RSI above/below 50 line Green square + Red border: R
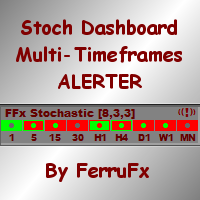
The FFx Dashboard MTF alerter will show you on a single chart all the timeframes (M1 to Monthly) with their own status for the indicator. 2 Alert Options: Single timeframe: each selected timeframe alert separately when a signal occurs Multi timeframes: all selected timeframes must agree for an alert to be triggered Both options have an input to select the timeframes to be used for the alert(s). How to understand the status: Green/Red square: Stoch above/below 50 line Green square + Red border:
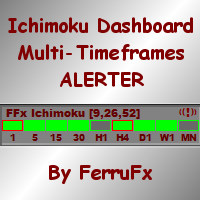
The FFx Dashboard MTF alerter will show you on a single chart all the timeframes (M1 to Monthly) with their own status for the indicator. 2 Alert Options: Single timeframe: each selected timeframe alert separately when a signal occurs Multi timeframes: all selected timeframes must agree for an alert to be triggered Both options have an input to select the timeframes to be used for the alert(s). How to understand the status: Green/Red square: Price above/below Cloud (Kumo) Green square + Red bo
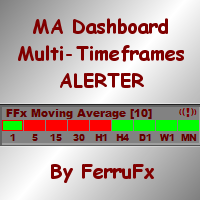
The FFx Dashboard MTF alerter will show you on a single chart all the timeframes (M1 to Monthly) with their own status for the indicator. 2 Alert Options: Single timeframe: each selected timeframe alert separately when a signal occurs Multi timeframes: all selected timeframes must agree for an alert to be triggered Both options have an input to select the timeframes to be used for the alert(s). How to understand the status: Green/Red square: MA pointing Up/Down Green square + Red border: MA po
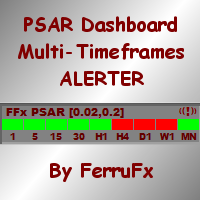
The FFx Dashboard MTF alerter will show you on a single chart all the timeframes (M1 to Monthly) with their own status for the indicator. 2 Alert Options: Single timeframe: each selected timeframe alert separately when a signal occurs. Multi timeframes: all selected timeframes must agree for an alert to be triggered. Both options have an input to select the timeframes to be used for the alert(s). How to understand the status: Green square: Price above PSAR Red square: Price below PSAR Options
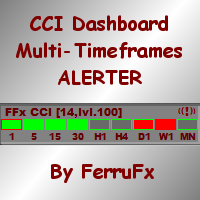
The FFx Dashboard MTF alerter will show you on a single chart all the timeframes (M1 to Monthly) with their own status for the indicator. 2 Alert Options: Single timeframe: each selected timeframe alert separately when a signal occurs Multi timeframes: all selected timeframes must agree for an alert to be triggered Both options have an input to select the timeframes to be used for the alert(s). How to understand the status: Green/Red square: CCI above/below levels (ie. 100/-100) Grey square: C
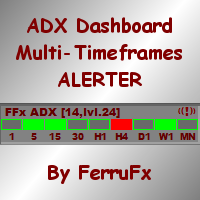
The FFx Dashboard MTF alerter will show you on a single chart all the timeframes (M1 to Monthly) with their own status for the indicator. 2 Alert Options: Single timeframe: each selected timeframe alert separately when a signal occurs Multi timeframes: all selected timeframes must agree for an alert to be triggered Both options have an input to select the timeframes to be used for the alert(s). How to understand the status: Green/Red square: ADX above level Grey square: ADX below level Red bor
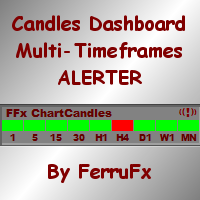
The FFx Dashboard MTF alerter will show you on a single chart all the timeframes (M1 to Monthly) with their own status. 2 Alert Options: Single timeframe: each selected timeframe alert separately when a signal occurs Multi timeframes: all selected timeframes must agree for an alert to be triggered Both options have an input to select the timeframes to be used for the alert(s). How to understand the status: Green/Red square: bullish/bearish candle Options available in the FFx Dashboard Alerter
THE GRAFF III
Charles Harper
The [GRAFF] III manual trading system is based on multiple MetaTrader (MT4) indicators. Together, the entire PACK of GRAFF III indicators makes an advanced trading tool. The system consists of over 20 different custom-built indicators which have been carefully selected and tested in the long term to produce strong and efficient trading signals. The particular indicators are based on different mathematical formulas, so the entire system is calibrated to remove false signals from its own indicator
This indicator allows you to see the strength of the trend on all timeframes. It can be used for all currency pairs. The indicator can be displayed in the form of a column (from left to right): status buy / sell / strong buy / strong sell, strength of the trend in percentage, pips last candle, body candle now, remaining time, and the timeframe of M1 to MN. Information contained below (from left to right): total trend percent, sell percent, buy percent.
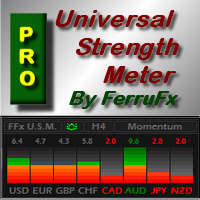
FFx Universal Strength Meter PRO is more than a basic strength meter. Instead of limiting the calculation to price, it can be based on any of the 19 integrated strength modes + 9 timeframes. With the FFx USM, you are able to define any period for any combination of timeframes. For example, you can set the dashboard for the last 10 candles for M15-H1-H4… Full flexibility! Very easy to interpret... It gives a great idea about which currency is weak and which is strong, so you can find the best pai
A simplistic indicator informing a user on RSI divergence by sending messages to mobile device and email. The indicator draws 2 vertical lines, marking two RSI extrema that formed the divergence. You get the alert, open the charts and make a decision. The indicator does not show past divergences, thus when you attach it to a chart for the first time you see nothing. Graphics and alerts will appear as soon as divergences do. Drop it in Tester to see how it works. Parameters: RSIPeriod - number of
Pan PrizMA CD Phase is an analogue of the МetaТrader 5 indicator , and is an option based on the Pan PrizMA indicator. Details . Averaging by a quadric-quartic polynomial increases the smoothness of lines, adds momentum and rhythm. Extrapolation by the sinusoid function near a constant allows adjusting the delay or lead of signals. The value of the phase - wave status parameter (which is close in meaning to the trigonometric phase or the angle of the radius-vector rotation in the trigonometric p
Green Wall Arrows
Daniel Luchinger
1 (1)
The Name Green Wall : Arrows hits a lot of TP, by changing the idea of non using SL as something bad, but instead use Small TP and a lot of free Margin and Patience. Use micro TP and a lot of Free Margin with this indicator on Forex. It also can be used with Binary Options. This strategy is intended to be traded Manually. This Indicator runs on Open Bar, arrows will delete when price are against it. The only Indicator Parameter is Alerts true/false, all the rest is included inside the code. Arro
Golden Monowave
Ahmed Mohamed Ali
Golden Monowave is monowave indicator, the monowave theory is one of Elliott wave approach and one of most complicate and accurate method. Golden Monowave can shortcut many major steps to identify and describe the monowave. It works on any timeframe and with any trading instrument, including currencies, indices, futures, etc. Input Parameters initial_Bars - set the initial number of bars to calculate. wave_color - select the color of the wave. label_color - select the color of labels. temp_labe
Shark Surfer
Roman Sheikin
Shark Surfer is a new generation indicator applying a well-established trend-following trading. The product is good both for scalping, as well as medium- and long-term trading. Shark Surfer analyzes a selected symbol and shows the recommended market entry, take profit and stop loss levels. Shark Surfer trades on all symbols and timeframes. It also features email and push notifications concerning the new trading signals. The indicator searches for suitable market entry points on an already formed
Ticks Size
Viktor Kolmakov
This indicator displays in a separate window the difference between the number of points which increased the price, and the number of points that decreased the price during the time interval specified in the settings. The time interval for calculation is expressed as the number of bars of the chart the indicator is attached to. This approach allows you to evaluate the movement direction (growth or fall) of the instrument's price, the strength of the movement and the size of the movement in point
FFx Basket Scanner
Eric Venturi-Bloxs
MetaTrader 5 version available here : https://www.mql5.com/en/market/product/24882 FFx Basket Scanner is a global tool scanning all pairs and all timeframes over up to five indicators among the 16 available. You will clearly see which currencies to avoid trading and which ones to focus on. Once a currency goes into an extreme zone (e.g. 20/80%), you can trade the whole basket with great confidence. Another way to use it is to look at two currencies (weak vs strong) to find the best single pairs
作者的更多信息
Trend Pulse One
Adolfina Denysenko
Trend Pulse One is a new generation indicator based on an improved version of Parabolic SAR, supplemented with arrow signals. Its purpose is to simplify the process of trend analysis and provide the trader with clear, visually understandable entry and exit points. The main difference from the standard SAR is that Trend Pulse supplements the SAR lines with arrows that signal a change in trend direction. This makes the indicator convenient for visual analysis and application in real trading.
Oracle flow
Adolfina Denysenko
指标目的: Oracle Flow 结合了技术指标和过滤器,旨在识别买入和卖出的市场入场点。该指标通过在图表上显示箭头信号,来提示潜在的趋势反转或延续。 ️ 主要使用元素: 指数移动平均线(EMAs) - 采用快慢两条周期线,通过交叉确认趋势强度。 相对强弱指数(RSI): - 评估趋势强度,当突破 50 水平线时生成信号,表明多空主导权转换。 多头力量与空头力量: ——测算多空力量失衡程度,以增强信号过滤效果。 布林带: - 监测价格是否突破通道范围。 波动率过滤: 该指标通过计算K线的平均波动区间(即高低点差),以优化入场点位。 信号形成条件: 买入信号(蓝色向下箭头): 快速EMA高于慢速EMA,基于前期值提示潜在反转; RSI 指标显示价格已突破关键支撑位。 多头动能确认上涨趋势,空头动能持续减弱。 价格位于布林带下轨下方。 附加筛选条件(特定周期内最高价与最低价的差值)可进一步增强信号强度。 卖出信号(红色上箭头): 快速EMA低于慢速EMA。 RSI 指标呈现下降趋势。 空头力量增强,多头力量减弱。 价格位于布林带上轨
Market Vortex
Adolfina Denysenko
市场漩涡指标.mq4 是一款强大的箭头指标,旨在精准识别趋势的反转点和延续点。该指标基于平滑振荡器和自适应移动平均线构建,能够帮助交易者快速确定市场进出点,无需进行复杂的计算。 核心特性: 清晰的箭头信号:指标直接在图表上显示买入或卖出的箭头。 实时运行:信号生成无延迟,并且不会重绘。 自适应计算:采用双EMA平滑算法,过滤噪音,呈现真实的趋势方向。 内置提示:实时显示当前趋势说明及持仓类型(多/空),便于选择交易方向。 多功能性:适用于任意货币对、时间周期以及交易风格(包括剥头皮交易、中期交易和日内交易策略)。 ️ 参数设置: 周期:计算移动平均线的周期数,数值越高,信号越平滑。 移位数:按K线移位进行精细调整。 市场漩涡如何运作? 该指标基于收盘价分析指数移动平均线。 比较平滑振荡器的连续数值。 当趋势方向发生变化时,会生成箭头。 蓝箭头:买入信号 红箭头——卖出信号 在实时模式下,趋势注释(买入趋势或卖出趋势)将同步显示。 交易者优势: - 消除情绪化失误,决策基于清晰信号 · 提升入场精准度——箭头精准
Fusion Cross
Adolfina Denysenko
Fusion Cross 是一款适用于 MetaTrader 4 的现代箭头指标,融合了多种成熟工具的优势。 WPR(威廉姆斯百分比范围); RSI(相对强弱指数) 这些工具的组合能够生成高度精准的市场入场信号,有效过滤虚假信号,仅显示趋势反转或延续概率较高的关键点位。 核心功能: 图表上直接显示清晰的买入/卖出箭头信号 即时通知 声音警报 电子邮件 手机推送通知 ️自定义信号触发时机:可选择在K线开盘时或收盘后触发(通过参数设置)。 适用于任意周期和货币对。 操作简易:安装后即可直接跟随信号进行交易。 工作原理: 指标通过 WPR 指标追踪超买/超卖状态。 借助RSI指标过滤虚假信号。 当市场即将上涨时,会出现蓝色向上箭头; 红色向下箭头则提示可能下跌。 Fusion Cross 因此能够帮助交易者提前捕捉趋势反转或延续的信号。 核心优势: 信号永不重绘(箭头位置固定不变); 兼容短线剥头皮与中期交易策略 多货币支持,适用于所有交易品种(包括但不限于: 外汇、黄金、指数、加密货币)。
PowerFlux Signal
Adolfina Denysenko
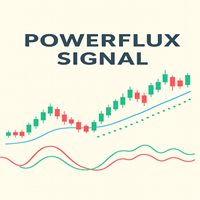
PowerFlux信号——一款无需重绘的强力箭头指标 PowerFlux信号是一款现代箭头指标,专为重视精准性、简洁性和及时信号的交易者设计。 该指标基于指数移动平均线(EMA)的交叉点开发,能即时捕捉趋势反转时刻,并提供清晰的买入或卖出视觉信号。 ️ 工作原理 该指标采用经典但优化的双EMA交互公式——快速EMA与慢速EMA。 当快速EMA自下而上穿越慢速EMA时发出买入信号;自上而下穿越时则发出卖出信号。 PowerFlux信号通过箭头即时在图表上显示这些事件: 绿色上行箭头(柠檬黄)——买入信号,可能开启上升趋势。 红色下行箭头(正红)——卖出信号,可能开启下降趋势。 核心优势 无重绘——信号实时生成,蜡烛线收盘后不会消失。 高精度——采用经实践验证的EMA交叉算法,适用于所有时间周期。 简洁稳定——新手与资深交易者皆宜。 参数灵活——可调整EMA周期适应任意策略。 广泛兼容——支持所有货币对、股票、加密货币及差价合约。 资源消耗低——轻量化优化代码确保即使在低配电脑或VPS上也能高
Quantum Balance
Adolfina Denysenko
Quantum Balance is a modern arrow indicator that identifies key price reversal points in the market with high accuracy. It is based on a combination of WPR (Williams %R) and RSI (Relative Strength Index), which allows you to identify overbought/oversold moments and enter trades at points of maximum potential. The indicator analyzes price dynamics and market conditions, generating signals only when several confirming factors coincide. This reduces the number of false signals and increases tradin
Aether Pulse
Adolfina Denysenko
以太脉冲——市场的以太脉动 以太脉冲是对箭头指标的全新诠释。 它不仅对市场波动作出反应——更能感知市场节奏的变化,精准提示趋势即将转向的时刻。 告别冗余箭头、噪音干扰与延迟——呈现纯粹的动量动态。 ️ 以太脉冲的工作原理 以太脉冲基于三大核心组件的协同作用: 1. 趋势引擎(21/55 EMA) 确定市场主方向。 当快EMA穿越慢EMA时,即预示趋势结构转变。 指标由此捕捉新行情启动的临界点。 2. 动能核心(MACD + RSI融合) 整合动量指标(MACD)与内部平衡指标(RSI)。 仅当两指标达成一致时触发信号,有效过滤噪音与随机波动。 3. 波动性防护 验证K线是否具备足够振幅。 自动忽略微幅波动与横盘整理,避免干扰判断。 信号逻辑 买入信号(上箭头)——EMA21高于EMA55,MACD>信号线,RSI>50,且K线收盘价高于EMA。 卖出信号(下箭头)——EMA21低于EMA55,MACD<信号线,RSI<50,且K线收盘价低于EMA。 箭头仅在趋势转向瞬间出现, 使信号虽稀少却尽可能精准。
Big bull mt4
Adolfina Denysenko
Big Bull mt4 is a powerful arrow trend indicator for MetaTrader 4, designed to accurately identify market directions and key reversal points without redrawing. The indicator combines price channel analysis, ATR volatility, and adaptive SMA filters to generate clear trading signals with confirmation in the form of arrows and trend lines. It is ideal for traders who value a clean chart, timely signals, and reliable entry points. Features and benefits No redrawing — signals remain on the ch
FX Strategy Pro
Adolfina Denysenko
FX Strategy Pro is a modern trading indicator designed to find high-probability entry points following a trend. It combines proven mathematical algorithms and signal filtering, allowing traders to receive clear and understandable signals without unnecessary noise. The indicator is ideal for both beginners and experienced traders looking to simplify market analysis and improve entry accuracy.  How it works: The algorithm is based on a combination of the Williams' Percent Range (WPR) oscillator
筛选:
无评论
回复评论