ZoneHunter MT4
- Indicadores
-
Paul Anderson
 I'm a retired Computer Science Professor who has been trading for over 20 years.
 - Versión: 1.2
- Activaciones: 5
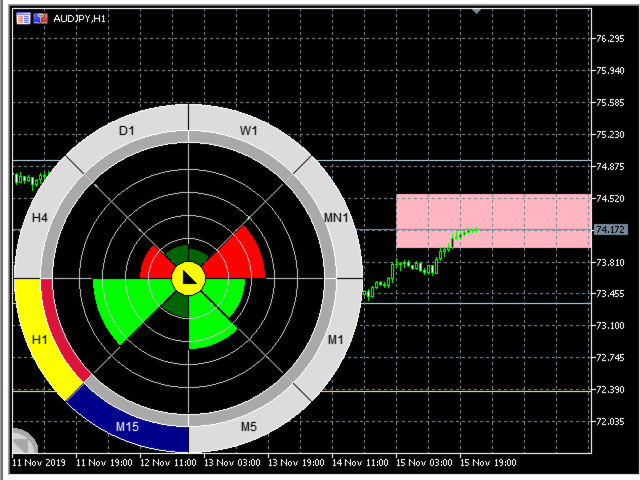
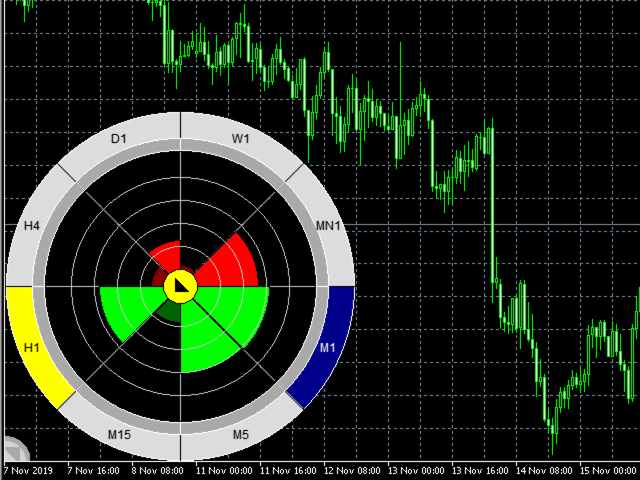
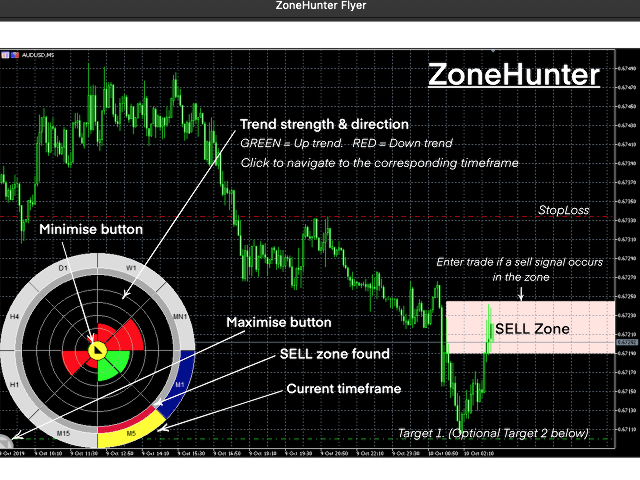
ZoneFinder es un panel de indicadores que presenta una visualización interactiva y multitemporal de la dirección y la fuerza de la tendencia. La fuerza y la dirección de la tendencia se miden mediante un indicador ADX modificado basado en valores DI+ y DI- suavizados.
Las zonas de alta probabilidad de negociación se identifican mediante retrocesos de Fibonacci. Cuando se encuentran estas zonas, se marcan en el gráfico junto con un objetivo de extensión de Fibonacci propuesto.