Trend Volume Profile and Rolling POC MT4
- Indicators
-
Duc Hoan Nguyen
 I develop practical trading tools for MetaTrader 4/5, with a focus on indicator integration, Multi-Timeframe analysis, market scanning, and automated trading solutions.
My work mainly includes:
• Indicator-to-EA Solutions - Version: 1.0
- Activations: 10
See more MT5 version at: Trend Volume Profile and Rolling POC — MT5
See more MT4 version at: Trend Volume Profile and Rolling POC — MT4
See more products at: All Products or Trading Indicators, Special Offers & New Releases
New tools will be $30 for the first week or the first 3 purchases!
Trading Tools Channel on MQL5: Join my MQL5 channel to get my latest news
Connect trend direction with areas of concentrated volume for a clearer view of the market. Follow changes in direction, identify notable activity zones and put each price move into the context of the current trend.
Trend Volume Profile and Rolling POC — Follow the trend, track key price areas
Trend Volume Profile and Rolling POC combines MA–ATR bands, Buy/Sell signals and an automatically anchored volume profile in one intuitive analysis tool. See the active direction, recognize a new phase and follow where volume concentrates as the trend develops.
Rolling POC highlights the price zone with the largest allocated volume in the current move. Together with Multi-Timeframe and Multi-Symbol Scanner, the indicator helps you broaden your monitoring and choose charts that deserve a closer look.
Highlights for your analysis workflow
- Read market direction clearly: bold trend lines highlight bullish and bearish phases while retaining historical segments for comparison.
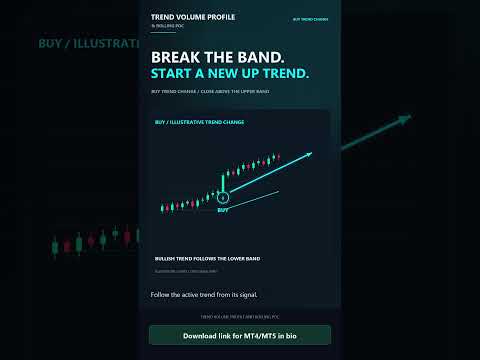
- Identify changes in state: Buy/Sell marks the candle that starts a new trend phase under the indicator's rules.
- View volume within each move: the profile anchors itself at the start of the trend and updates as price develops.
- Track key price areas: POC helps you observe price reactions around the current phase's volume concentration.
- Broaden your view: Multi-TF, Scanner and alerts support signal monitoring across symbols and timeframes.
MA–ATR bands: put price movement into context
Basis is the moving average that represents the underlying price movement. Upper Band and Lower Band extend around Basis according to ATR, forming a reference envelope that adapts to market volatility.
Watching price within this envelope helps distinguish movement around the average from a band break that meets the conditions for a trend change. The MA period and method control smoothing; the ATR multiplier controls the distance from Basis to the bands.
Increasing the ATR multiplier moves the bands farther apart; decreasing it brings them closer. This lets you choose the distance price must travel to generate a signal, in line with your timeframe and analysis approach.
Buy/Sell: focus on changes in trend direction
The indicator uses Close and the two bands to determine trend state:
- Buy appears when Close crosses above Upper Band, switching the state to bullish.
- Sell appears when Close falls below Lower Band while the state is bullish, switching the state to bearish.
- To return to a bullish state, a new cross above Upper Band is required.
Until a change condition is met, the previous state is maintained. A return inside the envelope or a move through Basis does not by itself change the trend. This helps you follow pullbacks within the context of the active trend.
Arrows mark changes in state; subsequent candles continuing in the same direction do not create additional trend-change signals. Use that point to follow the new phase, then combine the profile and POC to understand the volume distribution behind price movement.
Bold trend lines: follow an entire phase
Bullish Trend follows Lower Band during an uptrend, while Bearish Trend follows Upper Band during a downtrend. This display highlights the active direction directly on the price envelope, helping you retain context during short-term fluctuations.
Historical trend segments remain visible for comparing state changes and price action after signals. Basis and the two bands provide the reference framework, while the bold trend line identifies the corresponding phase.
Automatically anchored profile: understand volume within the current move
The profile starts from the opening candle of the current trend and incorporates data through the candle being evaluated. When the trend changes, the anchor moves to the new phase. You see the profile of the current trend, while historical trend segments remain available for comparison.
Within that range, the indicator divides price into horizontal zones and allocates each candle's volume according to the portion of its High–Low range passing through each zone. Volume is combined into a profile to highlight activity concentrations within the same trend move.
Longer, darker bars represent greater allocated volume within the same profile. Identify prominent zones and observe how price approaches, trades around or moves away from them. The profile color reflects the bullish or bearish direction of the entire phase.
Profile detail can be adjusted relative to ATR, letting you choose a broader view or a finer price distribution. Bar lengths are normalized within each profile, so compare zones within the same move when assessing volume concentration.
The profile is an estimate of volume distribution from candle data; it does not separate buy/sell or Bid/Ask volume. Understanding this helps you use it appropriately: identify notable activity zones and add context to price movement.
Rolling POC: a key price area that develops with the trend
POC (Point of Control) lies at the center of the price zone with the largest allocated volume in the current profile. It provides a prominent reference for following concentrated activity and price reactions when price revisits that area.
POC updates as price, volume and the trend's range change. You can follow shifts in the focal area throughout the phase rather than watching only a fixed price level.
Read the POC label in two parts: its position on the price axis shows the POC price; the number in the label, such as < POC: 9.15K, shows the volume of the POC zone. This is the volume of the largest zone in the profile, not the total volume of the entire trend.
Combine price's position relative to POC, trend state and the two bands for a fuller view. Buy/Sell signals continue to follow the trend-change rules; POC adds volume context for evaluating movement after a signal.
Adapt the view to your analysis approach
- Moving average: choose the period, MA method and price source to adjust how underlying movement is represented.
- Volatility envelope: adjust ATR and the band multiplier to change the reference distance around Basis.
- Profile detail: adjust Bin Size Multiplier to view volume distribution more broadly or in greater detail.
- Volume source: choose Tick Volume or Real Volume according to the symbol's data. Volume sources for the profile and VWMA can be selected separately.
- Chart information: independently show or hide lines, signals, the profile and the POC label to focus on the components you need.
Multi-TF and Scanner: broaden your coverage, focus on the right charts
Multi-Timeframe lets you choose the data timeframe displayed on the chart and use separate parameters for each timeframe. Follow context on a higher timeframe, then examine detail on a lower one to suit your workflow.
Multi-Symbol Scanner helps monitor Buy/Sell signals across symbols and timeframes. Choose the current symbol, Market Watch or a custom symbol list; when you need a closer look, switch to the corresponding chart from the Scanner.
Timeframe labels and the optional countdown help identify the timeframe being monitored. With multiple timeframes, read signals according to the signal timeframe's candles: a lower-timeframe chart candle may have closed while the higher-timeframe candle is still forming.
See the Multi-Timeframe & Scanner guide at the beginning of this description to configure symbol lists, timeframes and separate parameters.
Buy/Sell alerts: follow events on closed candles
The Buy Signal and Sell Signal alerts bring trend-change events into your monitoring workflow. Receive notifications for the current symbol or Scanner symbols through platform messages, Push Notification, Email and sound.
Alerts check the closed candle of the signal timeframe. Enable the alert scope you need in the settings; Push and Email require the corresponding MetaTrader configuration.
A clear workflow for applying the indicator
- Establish direction: read the bold trend line and price's position relative to Basis and the two bands.
- Identify a new phase: use Buy/Sell to locate a state change, then follow the development of the new price move.
- Find the focal area: examine prominent profile bars and POC to identify areas where price reactions deserve attention.
- Connect price and volume: after Buy, observe a return toward POC while the bullish state remains active; after Sell, use the corresponding approach for the bearish state. Assess this context before applying your own trading rules.
- Broaden your view: use Scanner to choose charts, Multi-TF for additional context and alerts to follow events on closed candles.
Read data consistently as the market updates
On the live candle, price and volume continue to change, so an arrow may appear and disappear before the candle closes. The profile and POC also update with the trend. When monitoring closed-candle signals, check the correct signal timeframe.
Choose Tick Volume or Real Volume to match the data supplied for the symbol; Real Volume requires the corresponding data feed. Timeframe, historical data and calculation settings all affect the displayed results.
Combine trend for direction, bands for price positioning and profile/POC for volume concentration. Start with one chart, learn how the components work together, then expand to Multi-TF and Scanner as needed. The indicator supports analysis; Entry, position size, Stop Loss and Take Profit remain part of your trading plan.