Watch the Market tutorial videos on YouTube
How to buy а trading robot or an indicator
Run your EA on
virtual hosting
virtual hosting
Test аn indicator/trading robot before buying
Want to earn in the Market?
How to present a product for a sell-through
New Technical Indicators for MetaTrader 5 - 15

QUANTUM PHASE - Advanced Quantum Resonance Trading Signals for MT5 Revolutionize Your Trading with Quantum-Inspired Cycle Synchronization! QUANTUM PHASE is a cutting-edge, non-repainting indicator designed for MetaTrader 5, harnessing the power of Quantum Phase Resonance (QPR) to deliver precise buy/sell signals based on synchronized market cycles. Inspired by quantum mechanics principles, this indicator detects phase alignments across multiple dominant cycles, filtering out noise for high-conf

-------------------------------------------------------------------------------------------------------------------------------------------------------------------------------------------------------------------------------------------------------------------------------------------------------------- MARKET PROFILE PRO - Professional Volume Analysis & Smart Trading Dashboard Transform Your Trading with Institutional-Grade Market Profile Analysis Market Profile Pro brings Wall Street's most pow

Profit maximizer (PMax) indicator for MetaTrader 5 (MT5) Check all of our products here: All Products
Specifications Platform: MetaTrader 5 (MT5)
Type: Custom Technical Trading Indicator
Level: Intermediate
Timeframes: All Timeframes (Multi-Timeframe Support)
Trading Styles: Scalping, Day Trading, Swing Trading, Position Trading
Markets: Forex, Stocks, Commodities, Indices, and Cryptocurrencies
Settings & Parameters Source – source of price ATR Period Multiplier of ATR Moving Average
Smart Multi-RSI Indicator for MetaTrader 5 (MT5) Check all of our products here: Seller - Mohammad Taher Halimi Tabrizi - taherhalimi - Trader's profile
Specifications Platform: MetaTrader 5 (MT5)
Type: Custom Technical Trading Indicator
Level: Intermediate
Timeframes: All Timeframes (Multi-Timeframe Support)
Trading Styles: Scalping, Day Trading, Swing Trading, Position Trading
Markets: Forex, Stocks, Commodities, Indices, and Cryptocurrencies What Does This Indicator Do? The Smart Mult

Overview Donchian Long Edge is a modern take on Richard Donchian’s classic channel breakout strategy — adapted specifically for long-only momentum and reversal entries. It combines the proven logic of Donchian breakouts with ATR-based buffers, rearm logic, and session-aware filters. The indicator highlights buy signals only , designed for trend-following and range-reversal trading approaches. This version introduces session start/end markers and time-based signal filtering , making it especially
ZigZag Fibonacci Master Indicator Master the Markets with Dual Fibonacci Intelligence ZigZag Fibonacci Master transforms complex market analysis into crystal-clear visual insights. This isn't just another ZigZag indicator - it's a complete trading intelligence system that combines precision swing detection, dual-layer Fibonacci projections, and smart distance calculations in one powerful tool. What Makes It Different? Three Tools in One Package: 1. Advanced ZigZag Engine Forget about market nois
RSI Cyclic smoothed Indicator for MetaTrader5
To download all of our products, you can click this link: LINK
Introduction The RSI Cyclic smoothed Indicator is one of the leading indicators in the market, which helps you enter your trades through the RSI line’s interaction with an upper and a lower line. It is one of the best indicators for scalpers
Specifications platform metatrader5 (MT5) type custom technical trading indicator level beginner timeframes all timeframes from weekly to tradin

Hull Moving Average (HMA) The Hull Moving Average (HMA) is a refined version of the traditional moving average, designed to minimize lag while keeping the line smooth and precise .
Developed by Alan Hull , this indicator provides a faster and more accurate trend signal than standard moving averages such as the SMA or EMA. How It Works The Hull Moving Average uses a Weighted Moving Average (WMA) in a special way to reduce delay and smooth price movement.
Its calculation follows three main steps:
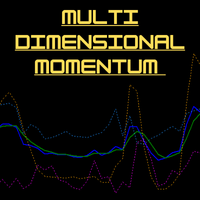
MDM indicator is the IMM (Integrated Market Momentum) line, which oscillates between 0 and 1. Here's how to interpret it: General Interpretation of the IMM Line : The indicator calculates this final value by combining momentum, trend, volume, aggressiveness, and price strength scores . Generally, readings above 0.50 suggest a strong bullish zone, while readings below 0.5 0 suggest a strong bearish zone. The area between 0.45 and 0.55 is often considered neutral or consolidating. Generating Tradi

Good old UT BOT converted from TradingView script by ' QuantNomad ', initially by ' Yo_adriiiiaan ' and ' HPotter ' - so you can bet this is powerful tool. If you know, you know. This is top of the line, while keeping it really simple.
Main function: trend identification with trend switch points , created by EMA(source) and ATR -source is CLOSE PRICE with option to use HEIKEN ASHI chart instead, for this you need "Heiken Ashi" indicator - its available as free download by MetaQuotes
One of th

The Follow Line Indicator is an essential technical analysis tool that provides a clear, immediate visualization of the trend while detecting high-probability reversals in real-time. By combining adaptive price tracking with clear visual alerts, it transforms complex data into actionable trading signals. Key Features Dynamic Trend Line: Tracks the market's prevailing direction, automatically adjusting to each new price extreme. Clear Colors: The line turns Blue during uptrends and Red during dow

The Custom Alert Lines.mq5 Indicator is designed to create two horizontal lines on the chart that serve as levels for alerts when the price crosses them. Key Functions and Features Two Customizable Lines (L1 and L2): The indicator allows the user to set the color, style, and thickness for each of the two lines via input parameters. Crossing Alerts: The indicator monitors when the closing price of the current bar crosses the level of one of the lines. Upon crossing, a pop-up alert is generated a
FREE
This indicator is a **Pivot-Confluence Zone Identifier** that focuses exclusively on identifying key support and resistance levels where price clusters align with classic pivot points. Here's what it does:
## Core Functionality
**Pivot Confluence Detection**: - Only displays price zones that align with classic pivot point levels (R1, R2, R3, S1, S2, S3) - **Excludes the main pivot point** - focuses only on support and resistance levels - Uses a configurable pip range to detect confluence nea
FREE
SignalFlow Pro - Professional Trend Analysis System SignalFlow Pro is a modern trend-following indicator designed to identify market reversals accurately and timely. Key Features: Dual-Color Trend Lines: Turquoise line - uptrend Fuchsia line - downtrend Clear visual separation for easy trend identification Signal Arrows: Blue arrow (↑) - Buy signal Pink arrow (↓) - Sell signal Arrows appear automatically when trend changes Customizable Parameters: Amplitude (2) - sensitivity level Arrow codes a
FREE
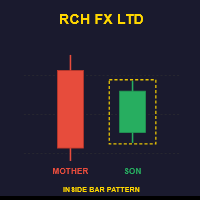
Want session filtering for your timezone? https://www.mql5.com/en/market/product/148638?source=Site +Profile Upgrade to the ADVANCED v1.40 for precise backtesting with customizable trading hours and GMT offset controls. Inside Bar Detector - Free Edition Automatically detects and marks inside bar patterns on your charts with visual rectangles. Simple, reliable, and works on all timeframes. Features: Real-time inside bar detection Customizable rectangle colors and styles Pop-up alerts for new sig
FREE

NeuraVault Pro v1.0 - Professional RSI Reversal Trading System Overview NeuraVault Pro is a professional automated trading system based on RSI (Relative Strength Index) reversals. It is designed to capture reversal opportunities in overbought and oversold zones, equipped with advanced filters and comprehensive risk management features. Trading Logic Core Strategy: RSI Reversal The EA captures reversal opportunities when the market reaches overbought or oversold zones: BUY Signal: RSI value drops
FREE

# Beepsticks v1.92 – Extended Technical Description
Beepsticks: - For those who want to rest their eyes and prefer to hear every tick! - For those who want to maintain control over the proper functioning of their trading platform and connection, even when they are unable to watch the screen for a period of time.
User Manual for Beepsticks v1.92 – Tick & Candle Direction Sound Alert Indicator for MetaTrader 5 Platform
---
## 1. Description
The `Beepsticks` indicator provides sound alerts o

Quantum Scalper – advanced adaptive EMA indicator for scalpers and trend traders.
It adjusts to market volatility, detects shifts instantly, and provides clear entry/exit levels.
Fast, lightweight, and highly accurate – your edge in the market.
Quantum Scalper – Precision Tool for Fast and Smart Trading Quantum Scalper is a cutting-edge indicator built on adaptive EMA logic with correction algorithms. It dynamically adjusts to price movements, filters market noise, and highlights precise entry
期間限定 無料ダウンロード NAS100 Scalper Signal Pro は、NASDAQ100専用に開発されたプロ仕様のスキャルピングインジケーターです。
シンプルな矢印サインに加え、 高精度フィルターを内蔵 することでノイズを軽減し、実戦向きのサインを実現しました。 主な特徴 M1・M5足に最適化 チャート上に矢印サインを表示 高精度フィルター搭載 (だまし削減・精度向上) アラート通知対応(ポップアップ / サウンド / プッシュ / メール) 複雑な設定は不要、導入後すぐに使用可能 スキャルピングから短期デイトレードまで対応 「シンプル × 高精度」 NAS100特化だからこそ可能になったシグナル精度を体感してください。 補足:レンジ相場ではシグナルが多く出る場合がありますが、爆発的なトレンド初動を逃さないための設計です。
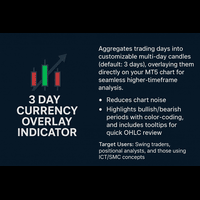
The 3-Day Currency Overlay Indicator aggregates trading days into customizable multi-day candles (default: 3 days), overlaying them directly on your MT5 chart for seamless higher-timeframe analysis. Ideal for forex, CFDs, indices and synthetics(deriv assets), it helps identify trends, support/resistance, and reversals without switching timeframes.
It displays 3Days timeframe just like every other timeframes.
It also accomodate for holidays, weekends or days with market closed in its calculati
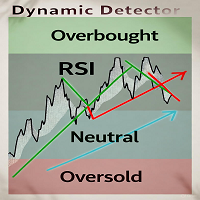
Dynamic Detector - Professional Trend and Signal Indicator This advanced indicator combines RSI and technologies to identify Overbought and Oversold zones in the market with precision. Key Features: Dynamic adaptive channels - automatically adjust to market conditions Clear visual signals - colored lines show trend direction Multi-level filters - reduce false signals Flexible settings - adapt to any timeframe and asset OB/OS zones - help identify entry and exit points Perfect for: Scalpers, da
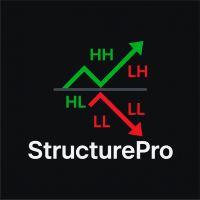
Descripción del indicador StructurePro 50 StructurePro 50 es un indicador avanzado de Market Structure diseñado para traders que buscan identificar de manera clara y objetiva los puntos clave de la acción del precio.
Con él podrás detectar automáticamente Higher Highs (HH), Higher Lows (HL), Lower Highs (LH) y Lower Lows (LL) , así como rupturas de estructura ( BOS ) y cambios de carácter ( CHoCH ). El indicador simplifica la lectura del mercado y elimina la subjetividad, permitiéndote cent

Channel Trend Bands – A Comprehensive Indicator for Market Analysis Simple to Use, Effective in Application User-Friendly and Suitable for All Traders This indicator stands out due to its straightforward functionality. Whether you're a beginner exploring the market or an experienced trader refining your strategy, this tool offers valuable insights. Using a Triangular Moving Average (TMA) with additional ATR-based bands , it provides structured market data to support well-informed decision-
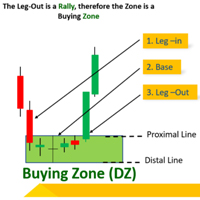
Have you ever been confused about identifying Supply and Demand zones? This indicator will work effectively to indicate the exact potential Supply and Demand zones. Core Features Smart 2-Candle Pattern Detection Identifies high-probability supply (bearish) and demand (bullish) setups with built-in ATR and candle-body filters to reduce noise.
Color-coded by Timeframe & Direction
Bullish arrows (Demand zones):
Pale Green – M15
Aqua – M30
Lime – H1
Navy – H4
Bearish arrows (Suppl
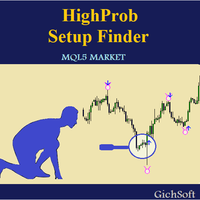
HighProb Setup Finder
Developer: GichSoft 2025
Overview
The HighProb Setup Finder is a precision-engineered market structure intelligence tool that visually reveals order flow transitions and reversal footprints directly on your chart.
It detects liquidity sweeps — where price grabs liquidity above or below a previous swing before reversing to target the opposite side. This helps traders identify institutional footprints and anticipate the next high-probability setup with confidence.
Cor
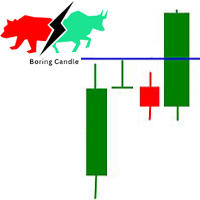
Potential Supply & Demand Compression Zone Indicator
This indicator identifies potential compression (supply & demand) zones across multiple timeframes. It highlights areas where the market has been consolidating and is likely to build up energy before a breakout.
When aarrow appears, it marks a potential breakout from the compression zone. Traders can then consider placing buy or sell orders in the direction of the breakout, following their own risk-management rules.
The indicator is design

Overview
All in One Swing Points is a precision swing detection indicator that automatically plots three levels of market swing structures—from the strictest 3-bar formations to long-term turning points—all in one visual layer.
This tool gives traders a clear, multi-timeframe perspective on price structure shifts, making it ideal for identifying market reversals, liquidity sweeps, and structure breaks with minimal clutter.
Key Features
a. 3 Swing Levels in One Indicator Strict 3-Bar S
Liquidity Sweep Detector – Detailed Description and Installation Guide Overview
Liquidity Sweep Detector is a powerful and versatile technical indicator designed to help traders identify stop hunts and liquidity grabs across any financial instrument and timeframe. Stop hunts occur when price temporarily breaches key swing highs or lows, triggering stop-loss orders from retail traders, before reversing direction. By visually highlighting these events, this indicator allows traders to better unde
Synchronize symbol changes across multiple charts instantly and effortlessly. Overview Chart Symbol Synchronizer is a professional tool for traders who work with multiple charts simultaneously. Change the symbol on your master chart, and watch all your follower charts update automatically in real-time. Perfect for multi-pair analysis, correlation trading, and efficient workspace management. Key Features Instant Synchronization - Updates all linked charts within 200ms Multiple Independent Gro

Overview Market Structure Analysis Indicator MT5 Structure Analysis Indicator automatically identifies Market Structure based on Smart Money Concepts (SMC). It clearly displays Break of Structure (BoS), Change of Character (CHoCH), Higher Highs, Higher Lows, Lower Highs, and Lower Lows in real-time. Key Features Automatic Market Structure Detection Break of Structure (BoS) - Price breaks previous structure in trend direction Change of Character (CHoCH) - Trend reversal signals Hi

Strategic Momentum EA is an automated trading system designed to identify and respond to short-term market movements using a momentum-based algorithm. It operates within predefined risk parameters and executes trades based on technical indicators without manual intervention. Functionality: The Expert Advisor monitors price action and volume shifts to detect potential entry points. It uses adjustable input parameters for risk management, trade frequency, and indicator sensitivity. The system is

Quantified Trendline Strength (QTS) Overview
Quantified Trendline Strength is a technical analysis tool that automatically detects and evaluates trendlines based on price swing structures. It provides a visual and quantitative way to understand how significant each trendline may be, allowing traders to make more structured observations of market behavior. Indicator Type Category: Trend / Level Detection Display: Chart window (overlay indicator) Purpose: Identify and evaluate trendlines, support

Momentum Confluence Zone (MCZ) – MetaTrader 5 Indicator Overview
Momentum Confluence Zone is a custom chart indicator for MetaTrader 5.
It calculates dynamic price zones using a combination of moving average, volatility, and momentum measures. The indicator aims to assist traders in observing areas where price behavior and momentum interact. Operation Logic The indicator uses an Exponential Moving Average (EMA) as a reference. Dynamic zones are calculated above and below the EMA using the Avera
Adaptive Market-Structure Grid (AMSG) Indicator Overview
The Adaptive Market-Structure Grid (AMSG) is a custom indicator for MetaTrader 5 designed to visualize evolving market structure through adaptive grid levels.
It detects price swings, constructs dynamic grids, and adjusts to changing volatility conditions.
The indicator helps traders observe how market structure shifts between trending and ranging phases. How It Works
AMSG continuously evaluates price data to identify swing highs and low

# Timeframepro - MT5 Candle Timer Countdown Indicator
## Overview Timeframepro is a professional MT5 indicator that displays a real-time countdown timer showing the remaining time before the current bar closes and a new bar forms. It provides essential time management functionality for traders who need to track candle closure times accurately.
## Key Features
### ️ Core Functionality - **Real-time Countdown Timer**: Displays remaining time in MM:SS format (e.g., "Time: 12:45") - **Server Ti
Dragon Bands Z: Visual Trend Analysis Indicator Dragon Bands Z is an indicator designed to simplify chart reading through the visual consolidation of multiple technical sources. Its objective is to provide a clear indication of market direction and strength, without the need for charts cluttered with numerous individual indicators. The indicator uses a hybrid color fill to translate price action into four primary visual states: Green: Indicates a predominant upward directional force. Red: Confir
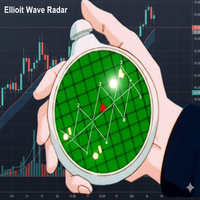
What This Indicator Does This indicator automatically analyzes the chart to identify Elliott Wave patterns (impulses and corrections) and shows you where waves 1, 2, 3, 4, and 5 are in real-time. It also includes price projections , volume validation , and triangle detection . How Does the "Radar" Version Improve on It? Target Projection: It suggests where the price might be headed in wave 5. Volume Validation: It confirms whether volume supports the detected pattern. Triangle Detection: It iden
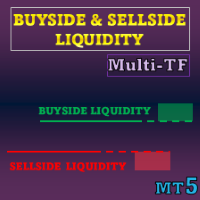
Special offer : ALL TOOLS , just $35 each! New tools will be $30 for the first week or the first 3 purchases ! Trading Tools Channel on MQL5 : Join my MQL5 channel to update the latest news from me This indicator visualizes liquidity levels and liquidity zones based on ICT concepts, plus Liquidity Voids to highlight one-direction price displacements. It focuses on where stop or pending orders tend to cluster and how those areas evolve once price trades through them.
Se

- Real price is 200$ - 50% Discount (It is 99$ now) - It is enabled for 5 purchases. Contact me for extra bonus (Gann Trend indicator), instruction or any questions! - Non-repaint, No lag - I just sell my products in Elif Kaya Profile, any other websites are stolen old versions, So no any new updates or support. - Lifetime update free Gann Gold EA MT5 Introduction W.D. Gann’s theories in technical analysis have fascinated traders for decades. It offers a unique approach beyond traditional cha

Haven RSI Candlestick is an innovative technical indicator that transforms the traditional line chart of the Relative Strength Index (RSI) into an intuitive candlestick chart format.
This tool is designed for traders who rely on technical analysis and aim to interpret market momentum and potential reversal points faster and more deeply. Other products -> HERE . Key Features: RSI Visualization as Candlesticks: The core feature. You can now directly apply Price Action methods and candlestick patte
FREE

FLEQBA Pro – Indicator Description This indicator is designed for MetaTrader 5 users to visually track the trading of their own strategies or expert advisors (robots) both retrospectively and in real time .
Its graphical display makes a trading strategy or robot’s performance much clearer and easier to understand than raw numbers alone. The indicator does more than simply display data: it analyzes, rates, and produces statistics , which can be retrieved instantly via on-chart buttons.
A built-in

Meta Cipher A: Precision Overlay Suite for Price Action Meta Cipher A brings the popular Market Cipher A concept to MetaTrader 5 as a precision overlay indicator. Engineered to display preemptive signals directly on your price chart, it combines an 8 EMA ribbon , WaveTrend analysis, and eight distinct signal types to help you spot entries, exits, and high-risk environments before they fully develop. While Meta Cipher A stands strong on its own, it is designed to pair naturally with Meta Cipher B
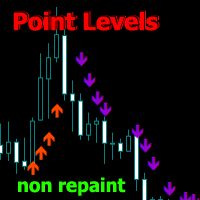
Point Directions MT5 - An indicator showing point levels of support and resistance when the price moves. The arrows show price bounces in the indicated directions.
The arrows are not redrawn, they are formed on the current candle. Works on all time frames and trading instruments. There are several types of alerts.
Has advanced settings to customize signals for any chart. Can be configured to trade with the trend and corrections.
For drawing arrows, there are 2 types of moving averages and an in

Trend Reversal Catcher with Alert MT5 Trend Reversal Catcher with Alert MT5 is a non-repainting, non-redrawing, and non-lagging price action indicator designed to identify precise market turning points.
It combines pivot detection , candlestick patterns (pin bars and engulfing setups), and an ATR-based volatility filter to deliver clean and reliable reversal signals. The indicator plots Buy/Sell arrows on the chart and sends real-time alerts , making it suitable for scalping, day trading, an
Please remember to rate the indicator to help me with visibility.
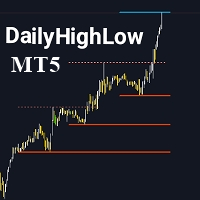
The DailyHighLow Indicator for MetaTrader 5 (MT5) provides a sophisticated tool for tracking daily price movements. Designed for traders who need clear, actionable insights into market highs and lows, this indicator automatically plots trend lines based on the highest and lowest prices over a customizable number of days. Key Features: Trend Lines Customization: Define colors, line styles, and widths for both broken and unbroken
FREE

The HiLo Ladder is a reinterpretation of the classic HiLo indicator , widely used by traders to identify trends and potential market reversals. Unlike the traditional version, the HiLo Ladder is displayed in a step-like format — the popular “stairs” — which makes reading price movements much clearer and more objective. Main advantages: Simplified visualization of bullish phases (green) and bearish phases (red). More intuitive analysis without losing the essence of the traditional HiLo. Quick
FREE

Moving Spread – Real-Time Market Cost Monitor Monitor the average spread in real time and avoid trading during high-cost periods. What does this indicator do? The Moving Spread measures the average spread (in points) of the market in real time, showing how it varies over time. It's an essential tool for traders who want to understand when the entry cost is too high, which can erode profits even before a trade begins. Why does it matter?
A high spread means you're paying more to enter and
FREE

Nuage Trend Pro – Trend Tracking & Kijun Signals Nuage Trend Pro is an advanced indicator for MetaTrader 5 , designed to quickly identify strong market trends and pinpoint optimal entry points through Kijun crossovers. Transform your charts into clear visual maps to trade with accuracy and confidence . Key Features Automatic Kijun Cross Detection : Instantly highlights key moments when price crosses the base line. Dynamic Trend Cloud : Your chart comes alive with intuitive colors – green f
This indicator processes historical tick‑data and tracks either the Spread in points (not pips), the Mid prices, the Ask or the Bid quotation prices, and displays the results in a sub‑window as OHLC candles. Charts on MetaTrader only show the bars/candles based on Bid quotes prices (or Last quote prices for certain types of symbols). However, that is not the complete picture as there is also the Ask quote prices to consider and the Spread between them. Every newbie trader has eventually discover

The Z-Score Correlation is a powerful tool that combines statistics and market analysis to deliver clear signals for both arbitrage and trend trading . What it does: Measures the dynamic correlation between two assets (e.g., EURUSD x GBPUSD). Applies the Z-Score to detect deviations beyond statistical standards. Identifies arbitrage opportunities when assets are excessively uncorrelated. Generates trend signals through the Z-Score crossover between the two pairs. Advantages:
Works for bo

Candlestick Scanner — Automatic Pattern Detector Summary The Candlestick Scanner is a powerful tool that automatically identifies over 20 classic candlestick patterns on both historical and real-time bars. For each detected pattern, the indicator draws a clear label on the chart, points to the candle with an arrow, and provides data for integration with your EAs and scripts. It includes a comprehensive notification system (Alert, Push, and Email) so you never miss an opportunity. [IMAGE: Screens

Here is the coherent translation of the text into English: The Oracle Oscillator is a true revolution in technical analysis. Instead of forcing the trader to watch multiple oscillators at the same time—like RSI, Stochastic, Williams %R, DeMarker, and the Laguerre Filter—this indicator unifies the best of each into a single hybrid line (DodgerBlue color), perfectly calibrated to be reactive to real movements while filtering out market noise , thus avoiding the false impulses that confuse so many

Fusion Monthly Levels + PinBar + Marubozu Description
This unique indicator merges three powerful technical analysis tools into one: Monthly Levels (High, Low, Open, Close) – to identify key support and resistance zones. PinBar Detection – a reliable reversal candlestick pattern signaling price rejections. Marubozu Detection – strong trending candles that indicate directional momentum. Thanks to this fusion, you get a visual, comprehensive, and responsive tool to anticipate market moves.

ABCD Lemissa + Monthly Levels + PinBar + Marubozu Indicator Description This indicator combines multiple powerful tools to provide a complete market overview: ABCD Lemissa – Automatically detects ABCD structures with points A, B, C, and D , support/resistance zones, and buy/sell arrows. Monthly Levels – Displays High, Low, Open, Close levels of monthly candles for identifying key zones. PinBar & Marubozu – Detects PinBar candles (reversal signals) and Marubozu candles (strong trend candles) w

The indicator SR POC VOLUME for MetaTrader 5 is designed to identify, cluster, and visualize Points of Control (POCs) derived from candle data over a configurable lookback period. Its goal is to provide a structured way to recognize areas of support and resistance based on accumulated volume activity and delta distribution, allowing traders to better understand where significant market interest has formed. Core Functionalities POC Calculation The indicator calculates a POC for each candle within
Consolidation Breakout Panel EA Consolidation Breakout Panel EA is a real-time smart dashboard that monitors multiple symbols and timeframes (M2, M5, M15, M30, H1, D1), automatically detecting price consolidations and identifying breakouts with volume-based strength classification. It is the perfect tool for traders who rely on breakout strategies , want to track multiple markets simultaneously , and need a clear view of the trend per timeframe . Key Features Consolidation Detection:
Auto

Order Block Pro (MQL5) – Version 1.0 Author: KOUAME N'DA LEMISSA
Platform: MetaTrader 5 Description: Order Block Pro is an advanced indicator designed to automatically detect bullish and bearish Order Blocks on your chart. By analyzing consolidation candles followed by strong impulsive candles, this tool highlights key areas where price movements are likely to accelerate. This indicator is perfect for traders who want to: Identify precise entry and exit points. Detect dynamic support and resist
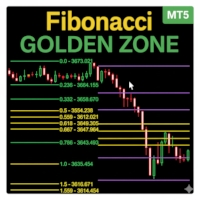
The Fibonacci Session Indicator is a powerful trading tool designed for precision scalping and intraday strategies. Thanks to Leandro López for this idea. MT4 version: https://www.mql5.com/en/market/product/150580 It automatically plots key Fibonacci levels for the New York, London, and Asia sessions, giving traders a clear view of price action dynamics across the major market sessions.
Unique "Golden Zones" are highlighted within each session, where price reacts the most. This creates highly
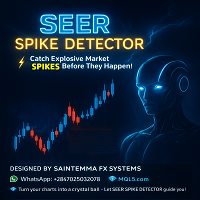
SEER SPIKE DETECTOR
The Ultimate Market-Reversal & Spike Forecasting Tool for Crash & Boom Indices, Forex & Synthetic Markets
SPECIAL BONUS (VALID TILL JUNE 2026)
AFTER PURCHASE CONTACT ME ON WHATSAPP +2347025032078 FOR MY PROP FIRM EA (TEST AND PROVEN) WITH MANUAL INSTRUCTION - FREE (CURRENTLY VALUED AT $450)
Best on M1 and M5 Stoploss: 10 Candles Maximum.
What is SEER SPIKE DETECTOR?
The SEER SPIKE DETECTOR is a next-generation market prediction indicator designed to detect and con
Strivex Supply/Demand Indicator for MetaTrader 5 The Strivex Supply/Demand Indicator automatically detects key supply and demand zones, marks market structure breaks (BOS), and alerts the trader in real time.
A special feature: The zones remain visible even if you change the chart timeframe. For example, you can display H1 zones on an M15 chart without them being redrawn or lost.
Key Features Automatic zone detection based on swing highs and lows Clear chart display – only the most recent
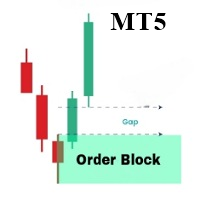
The OrderBlock Analyzer is a powerful custom MetaTrader 5 (MT5) indicator designed to detect and highlight critical Order Blocks on your price charts, helping you identify potential reversal points and key areas of market interest. Key Features: Order Block Detection: Automatically identifies bullish and bearish Order Blocks, marking areas where institutional traders are likely to enter or exit positions. Customizable Display: Choose your preferred colors and styles for bullish and bearish O
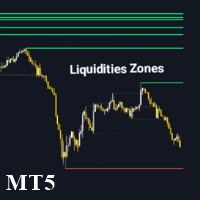
The Liquidity Zone Detector is an advanced technical indicator designed to identify and highlight key liquidity zones in the market using the ZigZag indicator. This tool pinpoints price levels where significant liquidity is likely present by drawing trendlines at the highs and lows detected by the ZigZag. The Liquidity Zone Detector assists traders in spotting potential reversal or trend continuation areas based on liquidity accumulation or release. Key Features: Automatic Liquidity Zone Identif
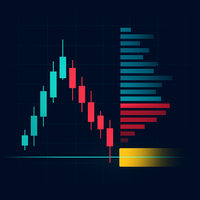
Technical Description of the Indicator – Delta Profile for MetaTrader 5 The Delta Profile is an indicator developed for MetaTrader 5 focused on detailed analysis of volume flow within a defined range of candles. It organizes and displays information about the imbalance of positive volumes (associated with upward movements) and negative volumes (associated with downward movements) at different price levels. The result is a clear view of the chart points where the highest concentration of trades o
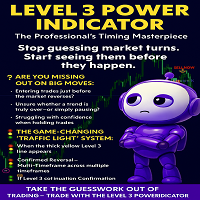
LEVEL 3 POWER INDICATOR
The Professional’s Timing Masterpiece
Stop guessing market turns. Start seeing them before they happen.
---
Are You Missing Out on Big Moves?
Entering trades just before the market reverses?
Unsure whether a trend is truly over—or simply pausing?
Struggling with confidence when holding trades?
You’re not alone. Most traders wrestle with these exact challenges… until they discover the Level 3 Power Indicator.
---
The Game-Changing “Traffic Light” Syst
FREE
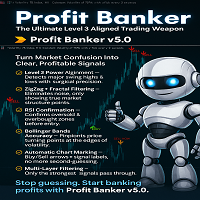
THE 4 GUARDIANS OF PROFIT BANKER
1. LEVEL 3 POWER INDICATOR (The General)
· Identifies MAJOR market turning points · Filters out noise and minor fluctuations · Only acts on significant high/low points
2. ZIGZAG FRACTALS (The Confirmer)
· Validates the Level 3 signals · Ensures swing point authenticity · Adds second-layer confirmation
3. BOLLINGER BANDS (The Boundaries)
· Identifies overextended price levels · Provides natural support/resistance zones · Ensures entries at op

Ritz Smart Detection BUY & SELL
The Ritz Smart Detection BUY & SELL is a next-generation trading indicator engineered to detect high-probability entry signals by combining ATR-based volatility measurement , trend reversal detection , and smart alerting technology . It delivers real-time BUY/SELL opportunities with adaptive targets and risk levels, making it a versatile tool for both scalpers and swing traders. Core Market Logic ATR-Driven Volatility Analysis Uses multiple ATR methods (SMA, EMA,
FREE

ETE Detector – Head & Shoulders Indicator Turn your charts into clear and actionable trading opportunities! About the Indicator The ETE Detector automatically identifies Head & Shoulders (H&S) and Inverse Head & Shoulders (IH&S) patterns — classic trend reversal formations.
No more spending hours searching manually: your analysis becomes fast, accurate, and visual . What You Get Automatic detection of trend reversal patterns Colored arrows : green for buys (Inverse H&S), red for sell

PO3 FIBONACCI GOLDBACH - The Definitive Indicator for Market Analysis
Unlock the Secrets of the Market with the Perfect Fusion of Advanced Mathematics and Intelligent Trading!
---
EXCLUSIVE FEATURES:
1. UNIQUE GOLDBACH LEVELS SYSTEM · Automatic identification of Order Blocks (OB), Fair Value Gaps (FVG), Liquidity Voids (LV), and Mitigation Blocks (MB). · Precise calculation of rejection blocks (RB) and equilibrium zones (EQ) based on the Goldbach Conjecture. · 111.1% and -11.1

MetaTraderPro Premium Indicator (MT5) The MetaTraderPro Premium Indicator is designed to clearly and objectively identify potential entry and exit points in the market. With signals displayed directly on the chart, it provides practicality and agility to support decision-making. Key Advantage: the indicator does not repaint and does not recalculate after the candle closes, ensuring consistent and reliable signals. Features: Buy and sell arrows directly on the chart No repainting or rec

ADVANCED MARKET ANALYSIS INDICATOR Overview of the Indicator
This is not a simple indicator — it’s a multi-analysis predictive system. It combines:
Volume Profile (POC, VAH, VAL)
Fibonacci Extensions
Pivot Levels (Daily, Weekly, 4H)
Trend Determination (MA-based)
Smart Money Concepts & Pattern Detection (basic placeholders for expansion)
Prediction Engine (projects price forward for 1 hour)
It gives you:
Target Price Line (projection)
Stop Loss Line (usually at Volume POC)
FREE
Learn how to purchase a trading robot from the MetaTrader Market, the store of application for the MetaTrader platform.
The MQL5.community Payment System supports transactions via PayPal, bank cards and popular payment systems. We strongly recommend that you test the trading robot before buying, for a better customer experience.
You are missing trading opportunities:
- Free trading apps
- Over 8,000 signals for copying
- Economic news for exploring financial markets
Registration
Log in
If you do not have an account, please register
Allow the use of cookies to log in to the MQL5.com website.
Please enable the necessary setting in your browser, otherwise you will not be able to log in.