Market Condition Evaluation based on standard indicators in Metatrader 5 - page 167
You are missing trading opportunities:
- Free trading apps
- Over 8,000 signals for copying
- Economic news for exploring financial markets
Registration
Log in
You agree to website policy and terms of use
If you do not have an account, please register
Forum on trading, automated trading systems and testing trading strategies
Press review
Sergey Golubev, 2016.04.15 16:27
EUR/USD Intra-Day Fundamentals: University of Michigan Index of Consumer Sentiment and 29 pips range price movement
2016-04-15 14:00 GMT | [USD - UoM Consumer Sentiment]
if actual > forecast (or previous one) = good for currency (for USD in our case)
[USD - UoM Consumer Sentiment] = Level of a composite index based on surveyed consumers.
==========
==========
EUR/USD M5: 29 pips range price movement by University of Michigan Index of Consumer Sentiment news event :
Forum on trading, automated trading systems and testing trading strategies
Press review
Sergey Golubev, 2016.04.16 09:23
EUR/USD Forecasts by Danske Bank (adapted from the source)
"EUR/USD has bought into fading ECB-Fed policy divergence after the ECB largely gave up the fight for euro depreciation and following recent dovish Fed comments. With positioning now much lighter in terms of short EUR/USD bets, we are probably entering a period in which relative rates could increasingly play a role again, and with a mere 50/50 pricing of a September Fed hike, and the ECB once again challenged on its mandate by market inflation expectations, we see relative rates moving for a weaker EUR/USD in 1-3M. Notably a negative Brexit risk premium could also be factored in ahead of the UK referendum but should be priced out swiftly in our main scenario of no Brexit."
"We keep our forecast profile unchanged, which leaves some downside near term (1-3M forecast at 1.12) followed by a sustained move higher towards 1.18 in 12M as valuation continues to drive the cross higher."
Forum on trading, automated trading systems and testing trading strategies
Forecast for Q2'16 - levels for USD/JPY
Sergey Golubev, 2016.04.16 15:35
USDJPY Technical Analysis 2016, 17.04 - 24.04: bearish ranging within key narrow s/r levels
Daily price is on bearish market condition located below Ichimoku cloud and below Senkou Span line which is the virtual border between the rpimary bearish and the primary bullish trend on the chart - the price is on ranging condition within the following narrow s/r levels:
Chinkou Span line is below the price indicating the ranging condition to be continuing by direction, Trend Strength indicator is estimating the primary bearish, and Absolute Strange indicator is evaluating the price movement as the secondary ranging condition.
If D1 price will break 107.66 support level on close bar so the bearish trend will be continuing.
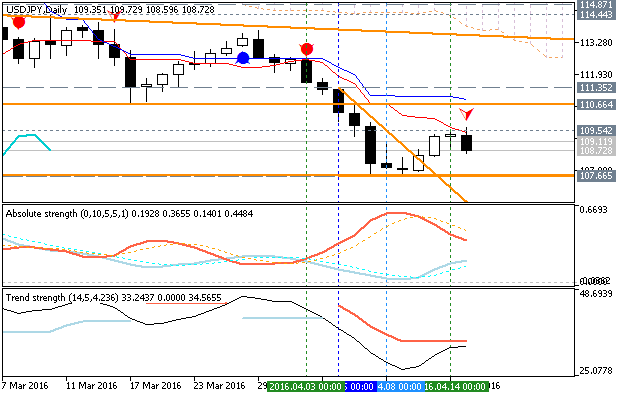
If D1 price will break 111.35 resistance level on close bar from below to above so the local uptrend as the bear market rally will be started within the primary bearish market condition.
If D1 price will break 114.87 resistance level on close bar so we may see the reversal of the price movement from the primary bearish to the primary bullish trend.
If not so the price will be on ranging within the levels.
SUMMARY : ranging
TREND : bearishForum on trading, automated trading systems and testing trading strategies
Forecast for Q2'16 - levels for Brent Crude Oil
Sergey Golubev, 2016.04.17 12:15
Crude Oil Medium-Term Technical Analysis: ranging near 200 SMA waiting for fundamental news for direction
The price is located near 200-day SMA (200 SMA) and below 100-day SMA (100 SMA) on the border between the primary bullish and the ranging bearish trend on the chart within the following narrow support/resistance levels:
RSI indicator is estimating the secondary ranging market condition.
Forum on trading, automated trading systems and testing trading strategies
Press review
Sergey Golubev, 2016.04.18 08:08
NZD/USD Intra-Day Fundamentals: NZ Consumer Price Index and 75 pips range price movement
2016-04-17 22:45 GMT | [NZD - CPI]
if actual > forecast (or previous one) = good for currency (for NZD in our case)
[NZD - CPI] = Change in the price of goods and services purchased by consumers.
==========
==========
NZD/USD M5: 75 pips range price movement by NZ Consumer Price Index news event :
Forum on trading, automated trading systems and testing trading strategies
Forecast for Q2'16 - levels for Brent Crude Oil
Sergey Golubev, 2016.04.18 09:31
Crude Oil Intra-Day Technical Analysis - breakdown with intra-day bearish reversal
H4 price is on the secondary correction which was started today morning because of Doha talks fail: the price broke key support level to be stopped near 100 SMA/200 SMA reversal area and near above 39.92 support bearish reversal level. If this 39.92 level will be broken by the price to below on close bar so the intra-day bearish reversal will be started, otherwise - ranging bullish.
SUMMARY : correction
TREND : waiting to reversalAfter Doha failure - new intra-day levels for AUD/USD and USD/CAD
USD/CAD M15: ranging on the bearish reversal area after good bullish breakout. This price for this pair broke 100 period SMA (100 SMA) and 200 period SMA (200 SMA) for good breakout up to 1.2989 resistance level. Intra-day price is located on the bullish area of the chart for the ranging within key s/r levels for the intra-day bullish trend to be continuing or to the bearish reversal to be started.
AUD/USD M15: breaking 0.7696 resistance to above for the reversed back to intra-day bullish. The price broke 100 SMA/200 SMA ranging reversal area to below for the primary bearish market condition. Intra-day price is on bear market rally for now for trying to break 100 SMA/200 SMA together with 0.7696 resistance once again to above to be reversed back to the bullish market condition.
Forum on trading, automated trading systems and testing trading strategies
Press review
Sergey Golubev, 2016.04.18 14:58
EUR/USD Intra-Day Fundamentals: FOMC Member Dudley Speaks and 16 pips range price movement
2016-04-18 12:30 GMT | [USD - FOMC Member Dudley Speaks]
[USD - FOMC Member Dudley Speaks] = The speech opening remarks at the Federal Reserve Bank of New York's conference.
==========
EUR/USD M5: 16 pips range price movement by FOMC Member Dudley Speech news event :
Forum on trading, automated trading systems and testing trading strategies
Press review
Sergey Golubev, 2016.04.18 20:04
Technical evaluation of long-term BNZ forecasts (adapted from the article)
Bank of New Zealand made a long-term forecasts for some pairs as the following:
(June 2016)
(September 2016)
(December 2016)
(March 2016)
As we do not know the trading system they used for this forecast so let's evaluate on technical way by Metatrader together with using free Codebase indicators.
EUR/USD. As we see from the chart below - weekly price is on bearish market condition with the ranging within the following key support/resistance levels:
The price is on local uptrend as the bear market rally to be started in the end of February this year: price is testing Fibo resistance level at 1.1464 to above for the rally to be continuing. The next alternative scenario was evaluated by BNZ and it is related to the following: the price will be on bearish ranging within narrow support/resistance levels such as the following: 23.6% Fibo level at 1.1241 and 50.0% Fibo level at 1.0993. Bank of New Zealand is expecting for this ranging bearish condition to be continuing up to the end of Q1'17 for example.
I think the more likely sscenario for this pair in long-term situation is to ranging with more wide levels within 1.1400 and 1.1000, and those levels are fully related to the daily chart's s/r/ levels together RSI and price pattern's expectation for example.
NZD/USD. BNZ is estimating for this pair to be on bearish ranging within very narrow levels with the bearish trend to be continuing since 0.6500 to 0.6100. But if we look at weekly chart so we can see the bearish market condition with the different ranging levels: the price is on ranging within Fibo resistance level at 0.6965 and 61.8% Fibo support level at 0.6564. By the way, the ascending triangle p[attern was formed by the price to be crossed for the bear market rally to be continuing with the possible buloish reversal to be started in the future.
RSI indicator is also estinating the secondary rally with possible bullish reversal.
Thus, the most likely scenarios for the pair are the following: bearish ranging within 0.69/0.65 levels, or the bullish erversal to be started in case the price breaks 0.6965 to above.