Something Interesting in Financial Video October 2016
Unlike the futures and equities markets, the forex market trades actively 24 hours a day with active trading hours following the sun around the globe to each of the major money centers.
As the foreign exchange market is an over the counter market where two counterparties can trade with each other whenever they want, technically the market never closes. Most electronic trading platforms however open for trading at around 5 PM Eastern Time on Sunday, which corresponds to the start of Monday's business hours in Australia and New Zealand. While there are certainly banks in these countries which actively make markets in foreign exchange, there is very little trading done in these countries when compared to other major money centers of the world.
The first major money center to open and there fore the start of the first major session in the forex market is the Asian Trading session which corresponds with the start of business hours in Tokyo at 7pm Eastern Time on Sunday.
While still considered 1 of the three major money centers, only 7.6% of forex transactions flow through Tokyo trading desks, so the Asian trading session is the least active of the three. While there is active trading in Yen based currency pairs during Asian hours the market for currencies outside of Yen based pairs is relatively thin, making Asian trading hours a time when the larger banks and hedge funds in the market will sometimes try and push the market in their favor.
Next in line is the European trading session which begins with the start of London business hours at 2 AM Eastern Standard Time. While New York is considered by most to be the largest financial center in the world, London is still king of the forex market with over 32% of all forex transactions taking place in the city. Before the Euro there were more than a dozen additional currencies in Europe making foreign exchange part of every day life for both individuals and businesses operating in the region. In addition to this, London is situated perfectly from a time zone standpoint with business hours for both the large eastern and western economies taking place during London trading hours.
As London is the most active session in the forex market it is also the session with the most volatility for all the currency pairs which we will be studying in this course.
Last but not least is the US session which begins with the start of New York business hours at 8 AM Eastern Standard Time. New York is a distant second to London in terms of forex trading volumes with approximately 19% of all forex transactions flowing through New York Dealing Rooms.
The most active part of the US Trading session, and the most active time for the forex market in general, is from about 8am to 12pm when both London and New York trading desks are open for business. You can see very large volatility during this time as in addition to both New York and London trading desks being open, most of the major US economic announcements are released during these hours as well.
The trading day winds down after 12pm New York time with most electronic platforms closing for business at around 4 PM Eastern Standard Time on Friday.
Behind central banks in terms of size and ability to move the foreign exchange market are the banks which we learned about in our previous lessons which make up the Interbank market. It is important to understand here that in addition to executing trades on behalf of their clients, the bank's traders often times try to earn additional profits by taking speculative positions in the market as well.
While most of the other players we are going to discuss in this lesson do not have the size and clout to move the market in their favor, many of these bank traders are an exception to this rule and can leverage their huge buying power and inside knowledge of client order flow to move the market in their favor. This is why you hear about quick market jumps in the foreign exchange market being attributed to the clearing out the stops in the market or protecting an option level, things which we will learn more about in later lessons.
The next level of participants is the large hedge funds who trade in the foreign exchange market for speculative purposes to try and generate alpha, or a return for their investors that is over and above the average market return. Most forex hedge funds are trend following, meaning they tend to build into longer term positions over time to try and profit from a longer term uptrend or downtrend in the market. These funds are one of the reasons that currencies often times develop nice longer term trends, something that can be of benefit to the individual position trader.
Although not the typical way that Hedge funds profit from the market, probably the most famous example of a hedge fund trading foreign exchange is the example of George Soros' Quantum fund who made a very large amount of money betting against the Bank of England.
In short, the Bank of England had tried to fix the exchange rate of the British Pound at a particular level buy buying British Pounds, even though market forces were trying to push the value of the Pound Down. Soros felt that this was a losing battle and essentially bet the entire value of his $1 Billion hedge fund that the value of the pound would decrease. The market forces which were already at play, combined with Soro's huge position against the Bank of England, caused so much selling pressure on the pound that the Bank of England had to give up trying to prop up the currency and it preceded to fall over 5% in one day. This is a gigantic move for a major currency, and a move which netted Soros' Quantum Fund over $1 Billion in profits in one day.
Next in line are multinational corporations who are forced to be participants in the forex market because of their overseas earnings which are often converted back into US Dollars or other currencies depending on where the company is headquartered. As the value of the currency in which the overseas revenue was earned can rise or fall before that conversion, the company is exposed to potential losses and/or gains in revenue which have nothing to do with their business. To remove this exchange rate uncertainty many multinational corporations will hedge this risk by taking positions in the forex market which negate any exchange rate fluctuation on their overseas revenues.
Secondly these corporations also buy other corporations overseas, something which is known as cross boarder mergers and acquisitions. As the transaction for the company being bought or sold is done in that company's home country and currency, this can drive the value of a currency up as demand is created for the currency to buy the company or down as supply is created when the company is sold.
Lastly are individuals such as you and I who participate in the forex market in three main areas.
1. As Investors Seeking Yield: Although not very popular in the United States, overseas and particularly in Japan where interest rates have been close to zero for many years, individuals will buy the currencies or other assets of a country with a higher interest rate in order to earn a higher rate of return on their money. This is also referred to as a carry trade, something that we will learn more about in later lessons.
2. As Travelers: Obviously when traveling to a country which has a different currency individual travelers must exchange their home currency for the currency of the country where they are traveling.
3. Individual speculators who actively trade currencies trying to profit from the fluctuation of one currency against another. This is as we discussed in our last lesson a relatively new phenomenon but most likely the reason why you are watching this video and therefore a growing one.
Renko Bar |Day Trading | What are Renko Bars | How do Renko Bars Work | Part 1
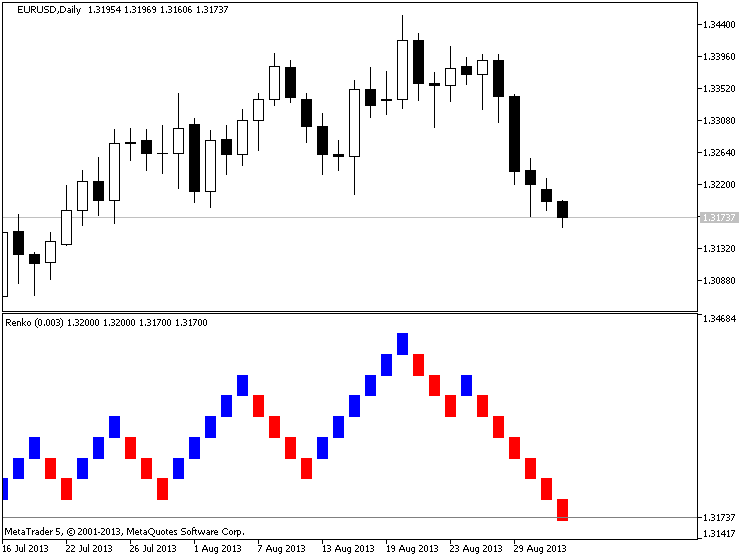
Renko Bars can be viewed as merely a different way to reflect price on a chart; in my opinion, I feel they paint the clearest picture of price available.
Here are my top 6 reasons of why I choose Renko Bars and charts:
- They REALLY help filter the noise
- They help smooth Indicators
- They can provide better entries
- They may help to provide smaller stops
- In my opinion they are just “cleaner”
- They help to filter noise and may help, keep us out of the chop.
Forum on trading, automated trading systems and testing trading strategies
Sergey Golubev, 2013.09.03 11:03
Renko (extraction from Achelis - Technical Analysis from A to Z)
============
Overview
The Renko charting method is thought to have acquired its name from "renga" which is the Japanese word for bricks. Renko charts are similar to Three Line Break charts except that in a Renko chart, a line (or "brick" as they're called) is drawn in the direction of the prior move only if prices move by a minimum amount (i.e., the box size). The bricks are always equal in size. For example, in a 5-unit Renko chart, a 20-point rally is displayed as four, 5-unit tall Renko bricks.
Kagi charts were first brought to the United States by Steven Nison when he published the book, Beyond Candlesticks.
Interpretation
Basic trend reversals are signaled with the emergence of a new white or black brick. A new white brick indicates the beginning of a new up-trend. A new black brick indicates the beginning of a new down-trend. Since the Renko chart is a trend following technique, there are times when Renko charts produce whipsaws, giving signals near the end of short-lived trends. However, the expectation with a trend following technique is that it allows you to ride the major portion of significant trends.
Since a Renko chart isolates the underlying price trend by filtering out the minor price changes, Renko charts can also be very helpful when determining support and resistance levels.
Calculation
Renko charts are always based on closing prices. You specify a "box size" which determines the minimum price change to display.
To draw Renko bricks, today's close is compared with the high and low of the previous brick (white or black):
-
If the closing price rises above the top of the previous brick by at least the box size, one or more white bricks are drawn in new columns. The height of the bricks is always equal to the box size.
-
If the closing price falls below the bottom of the previous brick by at least the box size, one or more black bricks are drawn in new columns. Again, the height of the bricks is always equal to the box size.
If prices move more than the box size, but not enough to create two bricks, only one brick is drawn. For example, in a two-unit Renko chart, if the prices move from 100 to 103, only one white brick is drawn from 100 to 102. The rest of the move, from 102 to 103, is not shown on the Renko chart.
Forum on trading, automated trading systems and testing trading strategies
Expert Advisors: Renko Line Break vs RSI EA
Sergey Golubev, 2014.03.28 07:39
The 3 Step EMA and Renko Strategy for Trading Trends (based on dailyfx article)- Many Forex traders use weighted moving averages, called EMA’s, to trade currency pairs that are trending.
- Determine the direction of the dominant trend direction with a 200 period EMA.
- Use price crossing a 13 period MA as both an entry trigger and manual trailing stop
Developed in the 18th century in Japan to trade rice, Renko charting is a
trend following technique. It is excellent for filtering out price
“noise” so traders can catch a major part a given Forex trend. It was
believed that the name “Renko” originated from the Japanese word ‘renga’
meaning ‘brick’.
Similar to Kagi and Point and Figure charting, Renko ignores the element
of time used on candlesticks, bar charts, and line charts. Instead,
Renko focuses on sustained price movement of a preset amount of pips.
For example, a trader can set the bricks for as little as 5 pips or as many as 100 or more. A new brick will not be formed until price has moved 100 pips. It could take 24 hours for a new brick to form or it could take just a few hours. However, no bricks will form until the preset limit is achieved.
Find the Trend Direction
Renko charts can incorporate many of the usual technical indicators like
stochastics, MACD, and moving averages. Today’s strategy will marry up
Forex Renko charts with a 200 Exponential Moving Average (EMA) to find
trend direction. Very simply, if price is trading above its 200 EMA,
then the trend is up. If price is trading below its 200 EMA, then the
trend is down.
This filter will give us a directional bias much like a compass or GPS. We will look to only take long trades when the Renko bricks are trending above the 200 EMA. On the other hand, in a downtrend, if the Renko bricks are trending below the 200 EMA, then the trend down. Forex traders will only look to short the market. One of the biggest mistakes swing traders make is entering trades that go counter to the dominant trend.
When to Get In
After the dominant trend direction is determined, traders can use the
simplicity of Renko charts with a single 13 period EMA as a ‘trigger’ to
signal an entry in the direction of the major trend. First, wait for at
least two green bricks to appear above the 13 EMA. Then enter long on
the appearance of the second green brick above the 13 EMA.
Exiting for Profit and for Loss
Once a trader is “triggered” into the trade, a protective stop can be
set one-brick size below the 13 EMA. As long as the bricks remain above
the 13 EMA, we look to stay with the trend. Just as the 13 EMA can get
you in a new trade, the same EMA can be used to stop out a winning trade
locking in profits.
Traders will need to manually move the stop one brick-size below 13 EMA
and the current price brick. You can see in the example above how the
combination of Renko and the 13 EMA helps traders stay with the trend a
longer time.
This is the 1st video in a series on economic reports created for all markets, or for those who simply have an interest in economics. In this and the next lesson, we cover the Employment Situation Report, also known as Non Farm Payroll.
============
Non-farm Payrolls (metatrader5.com)Non-farm Payrolls is the assessment of the total number of employees recorded in payrolls.
This is a very strong indicator that shows the change in employment in the country. The growth of this indicator characterizes the increase in employment and leads to the growth of the dollar. It is considered an indicator tending to move the market. There is a rule of thumb that an increase in its value by 200,000 per month equates to an increase in GDP by 3.0%.
- Release Frequency: monthly.
- Release Schedule: 08:30 EST, the first Friday of the month.
- Source: Bureau of Labor Statistics, U.S. Department of Labor.
============
FF forum economic calendar :
- Source : Bureau of Labor Statistics
- Measures : Change in the number of employed people during the previous month, excluding the farming industry
- Usual Effect : Actual > Forecast = Good for currency
- Frequency : Released monthly, usually on the first Friday after the month ends
- Why Traders Care : Job creation is an important leading indicator of consumer spending, which accounts for a majority of overall economic activity
- Also Called : Non-Farm Payrolls, NFP, Employment Change
============
mql5 forum thread : Non-Farm Employment Strategy
============
AUDUSD M5 with 45 pips in profit (by equity) for NFP :

EURUSD M5 : 87 pips price movement by NFP news event :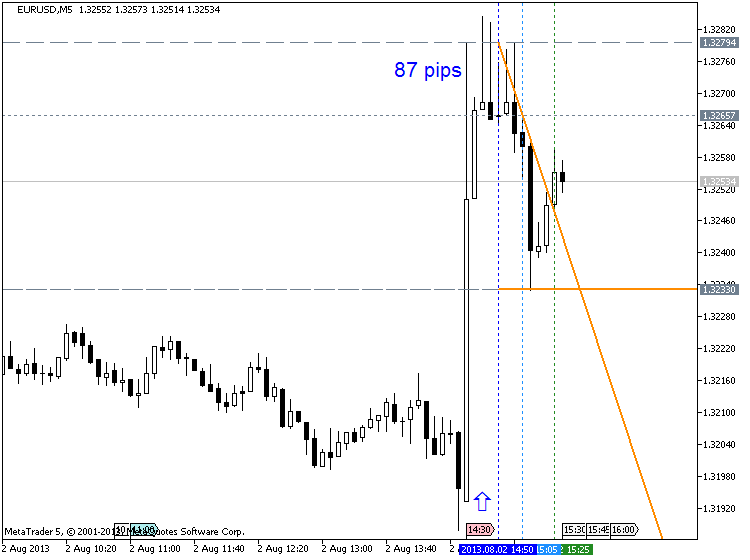
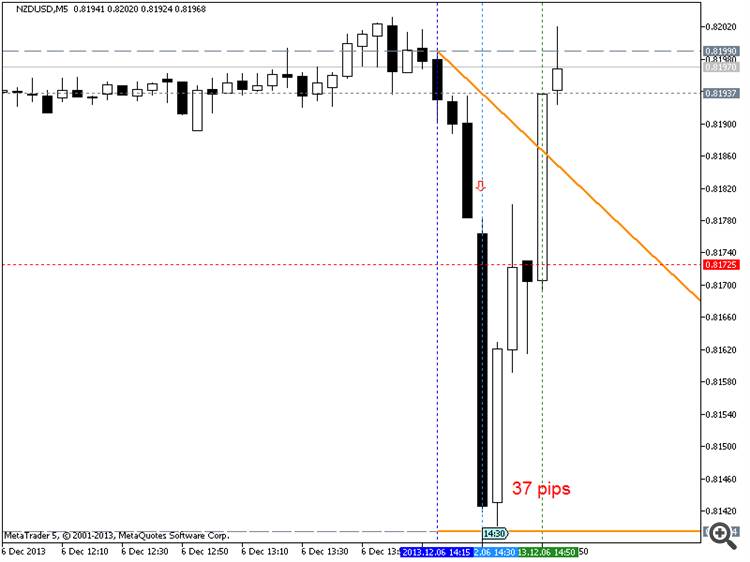
NZDUSD M5 : 37 pips price movement by USD - Non-Farm Employment Change :
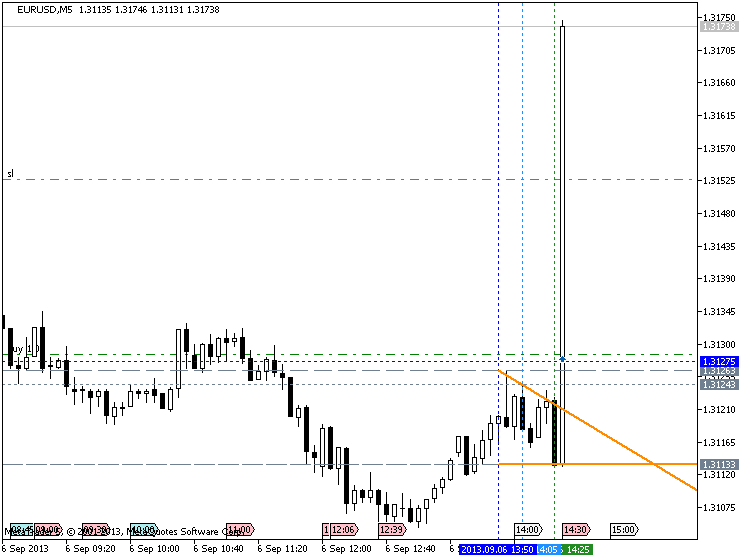
Trading EURUSD during NFP :
==================
02: NON FARM PAYROLL (Part 2): ECONOMIC REPORTS FOR ALL MARKETS
This is the second part of video lesson about nfp.
============
The Bollinger Bands were created by John Bollinger in the late 1980s.
Bollinger studied moving averages and experimented with a new envelope
(channel) indicator. This study was one of the first to measure
volatility as a dynamic movement. This tool provides a relative
definition of price highs/lows in terms of upper and lower bands.
The
Bollinger Bands are comprised of three smooth lines. The middle line is
the simple moving average, normally set as a period of 20 (number of
bar/ticks in a given time period), and is used as a base to create
upper/lower bands. The upper band is the middle band added to the given
deviation multiplied by a given period moving average. The lower band is
the middle band subtracted by the given deviation multiplied by a given
period moving averages.
What can we use this for?
- Trend -- When price moves outside of the bands, it is believed that the current trend will continue.
- Volatility- The band will expand/contract as the price movement becomes more volatile/or becomes bound into tight trading patterns, respectively.
- Determine Oversold/Overbought Conditions -- When price continues to hit upper band, the price is deemed overbought (may suggest sell). When price continues to hit lower band, the price is deemed oversold (may suggest buy).
In today's lesson we are going to talk about another method which Dr. Van K Tharp talks about in his book Trade Your Way to Financial Freedom, the % Volatility Model for position sizing.
As we have discussed in our previous lesson on the Average True Range, Volatility is basically how much the price of a financial instrument fluctuates over a given time period. Just as the Average True Range, the indicator that was designed to represent average volatility in an instrument over a specified time, can be referenced when determining where to place your stop, it can also be used to determine how large or small a position you should trade in a given financial instrument.
To help understand how this works lets take another look at the example we used in our last lesson on the % Risk Model for position sizing, but this time determine our position size using the % Volatility Model for position sizing.
The first step in determining what your position size will be using the % Volatility Model is specifying what % of your total trading equity you will allow the volatility as represented by the ATR to represent. For this example we will say that we will allow Daily Volatility as represented by the ATR to account for a maximum of a 2% loss of trading capital.
If you remember from the example used in our last lesson we had $100,000 in trading capital and we are looking to sell crude oil which in that example was trading at $90 a barrel. After pulling up a chart of crude oil and adding the ATR you see that the current ATR for Crude is $2.55. As you may also remember from our last lesson a 1 point or 1 cent move in Crude equals $10 per contract. So with this in mind that volatility in dollars per contract for crude equals $10X255 which is $2550.
So as 2% of our trading capital that we are willing to risk on a volatility basis equals $2000 under this model we cannot put a position on in this instance and would have to pass up the trade.
As Dr. Van Tharp states in his book, the advantage of this model is that
it standardizes the performance of a portfolio by volatility or in
other words does not allow financial instruments with a higher
volatility to have a greater affect on performance than financial
instruments with a lower volatility and vice versa.
Name of this video is Full Metatrader 5 Overview. Some MT5
features were not explained there but, anyway - it is interesting to
watch about Depth of Market feature and about other features of
Metatrader 5. To make it shorter - this is very quick overview (about 10
minues) about the differences of Metatrader 5 compare with Metatrader 4
for example.
Review of Metatrader 5 iPhone App
About Metatrader 5 mobile application :
How to Trade the GDP Number
A lesson on what traders of the stock, futures, and forex markets look
for when the Gross Domestic Product (GDP) Number is released.
As we have learned in previous lessons there are many components of the
US Economy which can affect overall economic growth and inflation
expectations. Some of the major examples here are how many people are
employed in the economy vs. unemployed, how much the housing market is
growing in different parts of the country, and at what rate the prices
for different products in the economy are seeing increases.
As all of these things are so important to the economy and therefore to
the markets, there are no shortage of economic reports which are
released to try and help people gauge how things are going with
different pieces of the economy. It is important for us as traders to
understand the major reports here as even if we are trading off of
technicals, understanding what is happening in the market from a
fundamental standpoint can help establish a longer term bias for
trading. In the short term an understanding of these numbers will also
help to assess the erratic and sometimes extreme movements which can
occur after economic releases.
The granddaddy of all economic reports is the release of the Gross
Domestic Product (GDP) number for the economy. The Gross Domestic
Product for the US or any other country is the final value of all the
goods and services produced in that economy. Essentially what you get
after calculating GDP by adding up the value of all goods and services
produced in the economy is a measure of the size of the overall economy.
It is for this reason that market participants will watch the GDP
number closely as the rate of growth in this number represents the rate
of growth in the overall economy.
As a side note here, GDP also allows a comparison to be made of the
sizes of different economies from around the world, as well as their
growth rates. To give you an idea of just how large the US Economy is,
2007 GDP for the United States was estimated at 13.7 Trillion dollars.
This is in comparison to the next largest economy in the world, Japan
which has a GDP of under 5 Trillion Dollars.
Quarterly estimates of GDP are released each month with Advance
Estimates which are incomplete and subject to further revision being
released near the end of the first month after the end of the quarter
being reported. In the second month after the end of the quarter being
reported preliminary numbers (which basically means more accurate than
advanced) normally are released and then finally the final GDP number is
released at the end of the 3rd month after the end of the quarter being
reported on.
Traders are going to focus heavily on the growth rate released in the Advanced number and markets will also move on any significant revisions made in the preliminary and final GDP numbers.
--------------
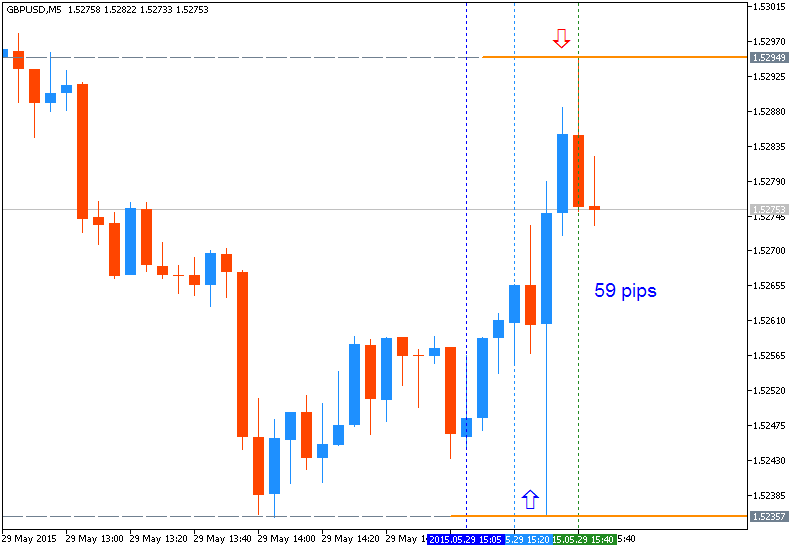
GBPUSD M5: 59 pips range price movement by USD - GDP news event:
--------------
EURUSD M5: 42 pips rangeprice movement by USD - GDP news event:

--------------
USDCAD M5: 83 pips price movement by USD - GDP news event:

- Free trading apps
- Over 8,000 signals for copying
- Economic news for exploring financial markets
You agree to website policy and terms of use
Please upload forex video you consider as interesting one. No direct advertising and no offtopic please.
The comments without video will be deleted.