Something Interesting in Financial Video November 2015
Forum on trading, automated trading systems and testing trading strategies
Something Interesting in Financial Video January 2014
Sergey Golubev, 2014.01.19 07:43
01: NON FARM PAYROLL (Part 1) - ECONOMIC REPORTS FOR ALL MARKETSThis is the 1st video in a series on economic reports created for all markets, or for those who simply have an interest in economics. In this and the next lesson, we cover the Employment Situation Report, also known as Non Farm Payroll.
============
Non-farm Payrolls (metatrader5.com)Non-farm Payrolls is the assessment of the total number of employees recorded in payrolls.
This is a very strong indicator that shows the change in employment in the country. The growth of this indicator characterizes the increase in employment and leads to the growth of the dollar. It is considered an indicator tending to move the market. There is a rule of thumb that an increase in its value by 200,000 per month equates to an increase in GDP by 3.0%.
- Release Frequency: monthly.
- Release Schedule: 08:30 EST, the first Friday of the month.
- Source: Bureau of Labor Statistics, U.S. Department of Labor.
============
FF forum economic calendar :
- Source : Bureau of Labor Statistics
- Measures : Change in the number of employed people during the previous month, excluding the farming industry
- Usual Effect : Actual > Forecast = Good for currency
- Frequency : Released monthly, usually on the first Friday after the month ends
- Why Traders Care : Job creation is an important leading indicator of consumer spending, which accounts for a majority of overall economic activity
- Also Called : Non-Farm Payrolls, NFP, Employment Change
============
mql5 forum thread : Non-Farm Employment Strategy
============
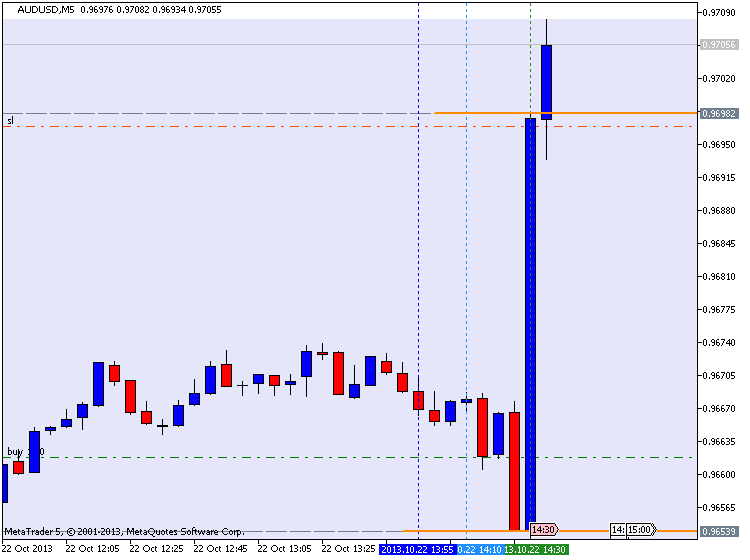
AUDUSD M5 with 45 pips in profit (by equity) for NFP :
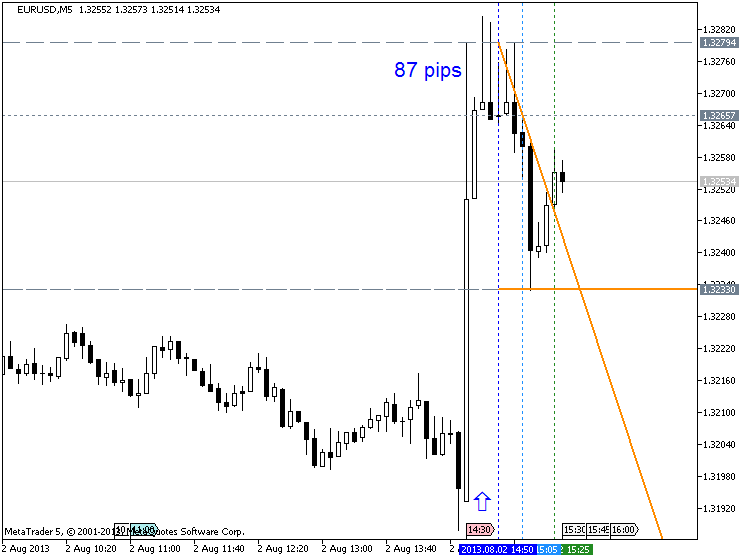
EURUSD M5 : 87 pips price movement by NFP news event :
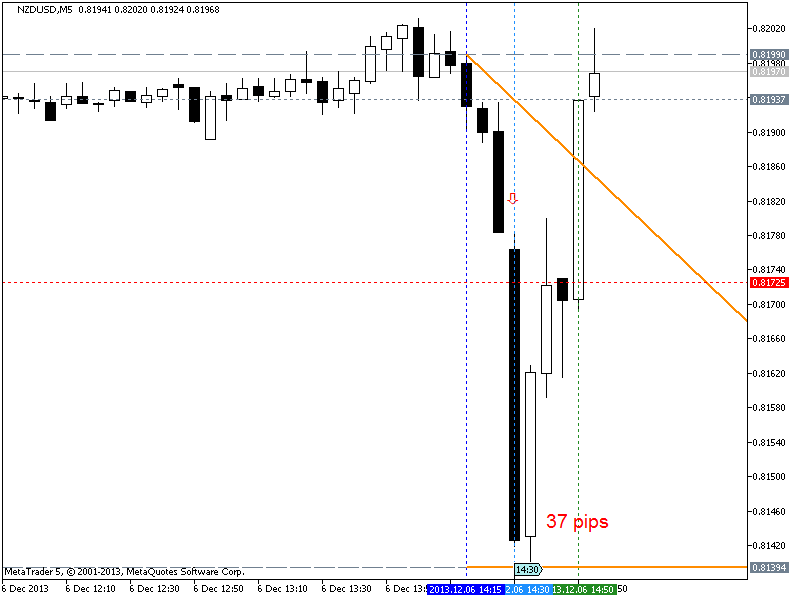
NZDUSD M5 : 37 pips price movement by USD - Non-Farm Employment Change :
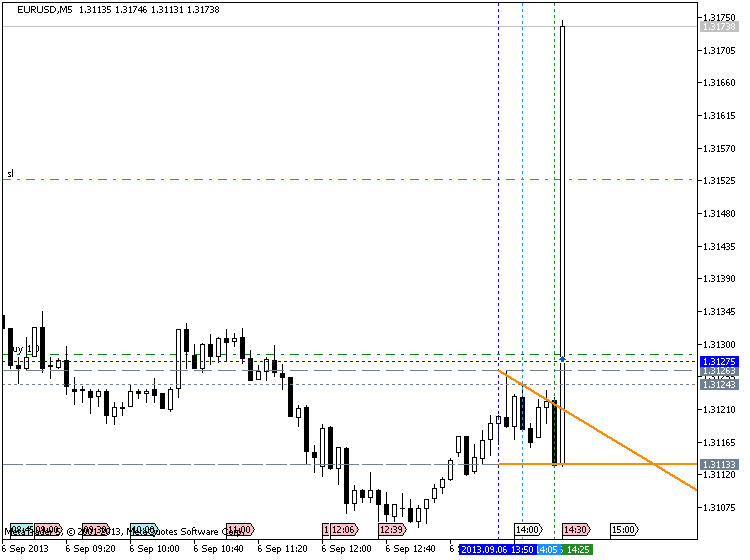
Trading EURUSD during NFP :
==================
Forum on trading, automated trading systems and testing trading strategies
Something Interesting in Financial Video January 2014
Sergey Golubev, 2014.01.23 12:58
02: NON FARM PAYROLL (Part 2)- ECONOMIC REPORTS FOR ALL MARKETS
This is the second part of video lesson about nfp. The first part of the lesson is on this post :
============
Forum on trading, automated trading systems and testing trading strategies
Something Interesting in Financial Video September 2013
Sergey Golubev, 2013.09.28 10:43
Interview With Al Brooks, Price Action Day Trader

Here is a summary of some of the key points:
1. Brooks is a price action trader with 27+ years of experience.
2. He is an active day trader, trading off the 5 minute chart. He trades the entire day.
3. He has a purely technical approach, relying totally on price action with just a few moving averages.
4. His approach is entirely rules-based; he not use any discretion and does not consider relying on intuition.
5. He states his setups have worked for decades and continue to work.
Brooks' analysis relies on measuring movements (i.e. retracements), gauging the strength of trends, and analyzing candlesticks.
Brooks has authored a number of books on trading. Interested traders may find it worthwhile to check out his page on Amazon.
Forum on trading, automated trading systems and testing trading strategies
Something Interesting in Financial Video September 2013
Sergey Golubev, 2013.09.28 10:38
Al Brooks' Moving Average Gap Bar StrategyThe basic elements of the strategy are as follows:
1. Identify a market that is in a bear trend on the 5 minute chart
2. Wait for a retracement in which the low of latest candle is above the 20 EMA
3. Go short, targeting the low of the day.
To be clear, Brooks' approach to price action trading is much more thorough; this strategy is just one tool in his arsenal.
Harmonic Trading Made Easy
Have you heard any recent "buzz" about something called Harmonic Trading or Elemental Trading? Until recently not many people in the investment and trading world were familiar with these techniques. Fortunately, you don't need to be a mathematician or engineer in order to get results in your trading from employing these highly probably chart patterns as part of your overall technical analysis.
Part of the knowledge now known as harmonic trading began with H.M. Gartley who published a book in 1935 called Profits in the Stock Market. This video illustrates what the original Gartley pattern is and how this pattern as well as the more recent discoveries can be easily employed in your trading business in Forex, stocks, commodities, and futures. 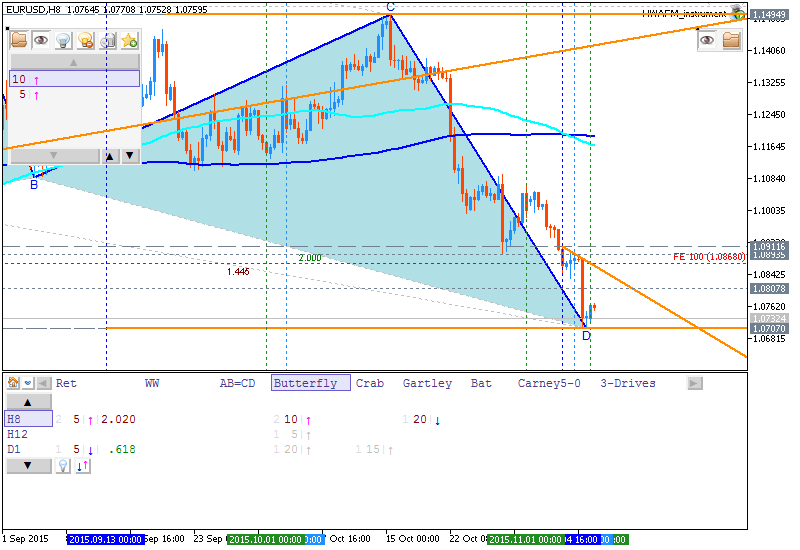
When a pattern forms with specific high and low proportions that are measured with fiboncacci ratios it has been discovered that these patterns will be followed by a "potential reversal zone" which creates a highly probably trading opportunity. Besides the original Gartley pattern including the bullish Gartley and bearish Gartley, there are patterns discovered more recently by Scott Carney in 2000 and 2001. Carney is credited with discovering and researching these patterns including the bullish bat, bearish bat, bullish crab, bearish crab, Traders who are familiar with Elliott Wave will also see how these patterns correspond to Elliott Wave patterns but are a specific type of pattern that is known to be highly probably for producing a turning point and a trade entry that is likely to work out as a profitable trade.
The structure of the Butterfly pattern was discovered by Bryce Gilmore. The butterfly includes a 78.6 Fibonacci retracement of the XA leg as the B point. The CD leg is extended to 127% or 161.8% of AB. 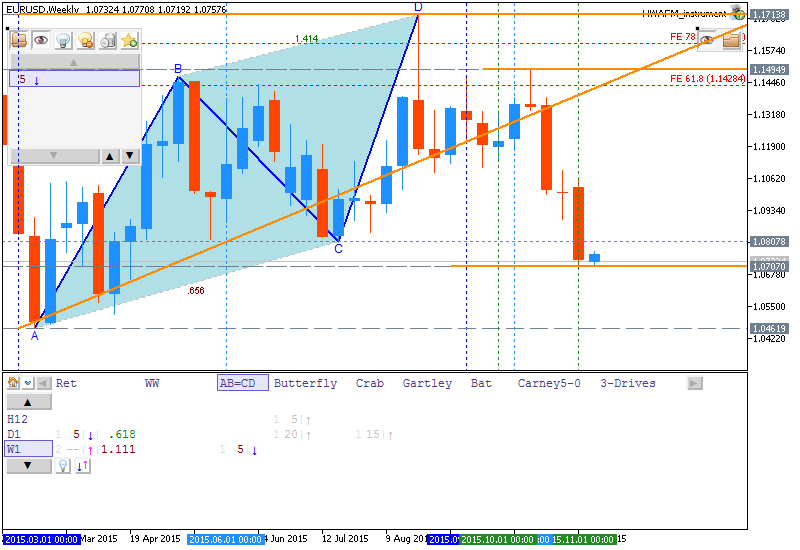
These patterns have now been incorporated into an indicator for Metatrader 4 and Metatrader 5 which draws the pattern clearly on the chart when it forms and produces a trading alert which can be emailed or sent as SMS text to a cell phone.
Al Brooks, E-mini day trader for over 20 years, covers in detail exactly how he trades the market from chart type, time frame, set-ups, entries, exits, money management.
'I have produced a 23 minute tutorial on Bollinger Bands. If you are not using this important indicator, you should be!'
Forum on trading, automated trading systems and testing trading strategies
Something Interesting in Financial Video June 2013
Sergey Golubev, 2013.06.01 10:47
Trading the Nasdaq 100 Index
Dominic Picarda from 'US Tech Focus Special in Spread Betting Magazine' is explaining about how to trade Nasdaq 100 Index
Forum on trading, automated trading systems and testing trading strategies
Something Interesting in Financial Video November 2013
Sergey Golubev, 2013.11.05 16:36
APF Tenkan Sen Kijun Sen
In this Second video, we introduce the first 2 lines of the Ichimoku system, the Tenkan Sen and Kijun Sen. Learn how these 2 lines are derived, their individual characteristics, and what it means when they cross each other.
====================
1. Tenkan Sen / Kijun Sen Cross
The Tenkan Sen / Kijun Sen Cross signal occurs when the Tenkan Sen (Turning line) crosses the Kijun Sen (Standard line).
1.1. A bullish signal occurs when the Tenkan Sen crosses from below to above the Kijun Sen
- A weak bullish signal occurs when the cross is below the Kumo.
- A neutral bullish signal occurs when the cross is inside the Kumo.
- A strong bullish signal occurs when the cross is above the Kumo.
- A weak bearish signal occurs when the cross is above the Kumo.
- A neutral bearish signal occurs when the cross is inside the Kumo.
- A strong bearish signal occurs when the cross is below the Kumo.
====================
Forum on trading, automated trading systems and testing trading strategies
Something Interesting in Forex Video May 2013
Sergey Golubev, 2013.05.01 14:22
High Frequency Trading Explained (HFT), 30 min 01 sec
Dave Fry, founder and publisher of ETF Digest, and Steve Hammer, founder of HFT Alert, discuss high frequency trading operations, fundamentals, the difference between algorithmic trading and high frequency trading, fluttering, latency and the role high frequency trading had in the May stock market flash crash in 2010.
- Free trading apps
- Over 8,000 signals for copying
- Economic news for exploring financial markets
You agree to website policy and terms of use
Please upload forex video you consider as interesting one. No direct advertising and no offtopic please.
The comments without video will be deleted.