Something Interesting in Financial Video November 2013 - page 2
You are missing trading opportunities:
- Free trading apps
- Over 8,000 signals for copying
- Economic news for exploring financial markets
Registration
Log in
You agree to website policy and terms of use
If you do not have an account, please register
APF Tenkan Sen Kijun Sen
In this Second video, we introduce the first 2 lines of the Ichimoku system, the Tenkan Sen and Kijun Sen. Learn how these 2 lines are derived, their individual characteristics, and what it means when they cross each other.
====================
1. Tenkan Sen / Kijun Sen Cross
The Tenkan Sen / Kijun Sen Cross signal occurs when the Tenkan Sen (Turning line) crosses the Kijun Sen (Standard line).
1.1. A bullish signal occurs when the Tenkan Sen crosses from below to above the Kijun Sen
- A weak bullish signal occurs when the cross is below the Kumo.
- A neutral bullish signal occurs when the cross is inside the Kumo.
- A strong bullish signal occurs when the cross is above the Kumo.
1.2. A bearish signal occurs when the Tenkan Sen crosses from above to below the Kijun Sen====================
APF Kumo Support Resistance
We discuss how the Kumo cloud serves as an effective support or resistance, the difference between thick and thin clouds, and how they provide us information on current price sentiment.
Kumo Breakout
The Kumo Breakout signal occurs when the price leaves or crosses the Kumo (Cloud).
APF Chikou Span
In this video, we discuss in detail the Chikou Span, how it is derived, how it interprets current price action, and very importantly, how it serves as a confirmation before entering a trade.
==================
Chikou Span - Lagging line
The closing price plotted 26 days behind.
The Chikou Span, also known as the Lagging line, is the closing price plotted 26 trading days behind, i.e. into the past, providing an at-a-glance view of how the price compares to that 26 days ago.
The trend is deemed to be upward when the Chikou Span is above the closing prices and downward when it is below them. The relationship is not always clear when looking at historical data, but becomes more obvious when looking at current charts.
The Chikou Span is also considered of use for confirmation of trends, momentum, and support and resistance levels highlighted by the other Ichimoku elements.
==================
Ichimoku
==================
How to Use the Dollar Index to Profit from Forex
The US dollar index can be a very powerful tool when making trades in the forex market. In today's must-watch video, Evaldo Albuquerque, Editor of FX Breakout Alert, uses a chart of the dollar index to teach you how to recognize when to buy and when to sell USD against other currencies like the euro (EUR). The dollar has been trading in a sideways range for several months now and a breakout is coming. So make sure you watch this video and are ready to profit from the dollar's breakout!
=============
How to use U.S. Dollar Index (USDX) Indicator in trading for forex and futures/stocks! Go here https://www.mql5.com/en/forum/2841 and https://www.mql5.com/en/forum/9178 to download indicators (two indicators up to your choice) and to know about how to use it in practical trading way.
=============
Forum
Indicators: USDx dollar index
newdigital, 2013.11.06 15:02
Dollar Index Futures & Correlations to Crude Oil & Gold Futures Trading
Scalpers, Intra-Day, Position & Swing traders alike benefit from the correlations seen between the US Dollar Futures Index (DX) & Commodity Futures such as Gold (GC) & Crude Oil (GC). The US Dollar Index Futures is one of the most widely-recognized electronically-trader markets in the world. Comparing the USD against a basket of major currencies, this futures index has relatively low daily trading volume compared to Euro or Pound, and is primarily used for its strong correlations to aid traders in many different situations. Professional traders watch the Dollar Index at the times it is most active, which occurs from 8am to 12pm EST during trading days. The times also correspond well with Crude Oil & Gold futures, which also see more activity at these times as well.There are many ways to use the US Dollar Index for trading opportunities, but most traders find the DX to be most consistently-used as a filter for high-risk trades.Let's first discuss the basic correlation that traders use. There is a negative correlation between the DX and almost every other market that traders watch. The Dollar is negative to other currencies b/c it's the world reserve currency, and it's negative to commodities b/c of the simple laws of supply and demand. Let's focus on the correlation to Gold & Crude Oil Futures.
As traders, there are lots of different times in the day when the dollar begins to move more dramatically, such as the open of the US Markets @ 9:30am EST, before and after major news events such as Jobless Claims Reports or FOMC News. We look for the Dollar to begin its trend, and using the negative correlation between these markets, we look for crude oil & gold opportunities to the opposite of the dollar's trend. When the Dollar is trending, traders use Breakout Patterns to capitalize on this correlation. With the dollar rising, look for high-percentage entries to the short side of Gold or Crude Oil Futures.
Most traders will use the Dollar correlation as a filter because it allows them to avoid high-risk entries on Gold & Crude Oil Futures. Without a trend on Dollar, the Gold & Crude Oil Futures also show flat price action, and tend to reverse their current trends often. The dollar has a tendency to get very choppy during indecisive times in the market, and we tend to stay away from higher-risk trading on Crude Oil & Gold during these times.
Another important thing to watch on the Dollar is key Support & Resistance around simple chart patterns. For example, using a Head & Shoulders pattern on the Dollar, traders will avoid trading Gold & Crude Oil when the Dollar attempts to complete the trend reversal. Smart traders will wait to trade the reaction to the move around these extreme levels, rather than trying to be the first to enter the market when the Dollar here. In closing, the Dollar Index Futures can be used very effectively with a negative correlation with many of the market we love to trade. Of all the uses for this index, the most effective way most traders use the Dollar is as a filter, to avoid taking high-risk trades on other markets such as Crude Oil & Gold.
Forum
Indicators: USDx dollar index
newdigital, 2013.11.06 15:03
Based on - U.S. Dollar Index - USDX
U.S. Dollar Index (USDX) was introduced in March 1973, when the Bretton Woods system ceased to exist. The index shows the ratio of U.S. dollar against a basket of six major world currencies - the euro is (EUR), Yen (JPY), British Pounds (GBP), Canadian Dollar (CAD), Swedish krona (SEK) and Swiss Franc (CHF). As part of this basket each currency has its own weight:
EUR - 57,6%
JPY - 13,6%
GBP - 11,9%
CAD - 9,1%
SEK - 4,2%
CHF - 3,6%
The composition of the basket of 1973 changed only once - in 1999, when the euro was introduced.
At the time of occurrence of the index had a value of 100 points. Historic lows it reached in March 2008 - 70.7 points, while the maximum value was recorded in February 1985 - 148.1 points. The index traded at the time of the global currency markets - 24 hours a day, 5 days a week. Trading on the Stock Exchange are ICE (Intercontinental Exchange) - The former New York Mercantile Exchange (NYBOT - New York Board of Trade). Moreover, the index is presented in the form of various traded instruments: the exchange funds (exchange traded funds, or ETF), mutual funds (mutual funds), stock options.
The index is calculated as a weighted geometric mean of the above mentioned currencies according to the following formula:
USDXt = 50,14348112 x (EURt) -0,576 x (JPYt) 0,136 x (GBPt) -0,119 x (CADt) 0,091 x (SEKt) 0,042 x (CHFt) 0,036
In the formula, the power coefficients corresponding to the weights of currencies in the basket. Calculation of the index coincides with the data used in calculating the Fed trade-weighted dollar index of currencies of countries which form the main foreign trade turnover of U.S..
Most of the international trade in the U.S. accounts for the euro area (57.6%), followed by Japan - 13.6% United Kingdom - 11.9% Canada - 9.1%, Sweden - and Switzerland 4.2% - 3.6 %.
How to use the dollar index on the forex?
It is important to understand whether you like it or not, dictates that the U.S. dollar trends of major world currencies, so the index is an excellent starting point for determining the strength or weakness of U.S. dollar currency pairs.
As a rule, the change trend of the index leads to changes in the trends of the currency pairs in which the USD and he is present. For example, during an uptrend USDX pairs with direct quote will also increase (eg, USDCHF, USDCAD), a couple from the back - slow down (it EURUSD, GBPUSD). Using technical analysis toolkit, such as candlesticks, support / resistance levels, moving averages, you can get an idea about the strength of the U.S. dollar in terms of long-term trends, the possible long-and short-term reversals, as well as changes in the attitudes of market participants.
Candlestick Charting - Bullish Engulfing Pattern
Forum
Indicators: ytg_Japan_Candles
newdigital, 2013.11.07 08:22
Trading the Bullish Engulfing Candle Pattern
Talking Points
Spotting price reversals and continuations through the interpretation of price action is an important skill for Forex traders to master. Candlestick analysis can help make this process easier. Candle pattern interpretation does not only make navigating the market easier, but it can also be a useful trading tool. With this idea in mind we will focus on recognizing and trading one of the markets most clear cut price action signals, the bullish engulfing candle pattern.
What is a bullish engulfing pattern?
A bullish engulfing pattern is a candlestick pattern normally foundafter a period of downward market pressure. Pictured above we can see that the bullish engulfing candle pattern is actuallycomprised of two completed candles! The first candle will normally depict the end of the currency pairs established weakness. This first candle can come in a variety of shapes and sizes and will vary from chart to chart.While it is notdirectly related to the next engulfing pattern, this candle should denote the end of the markets current decline. Small candles such as dojis are considered preferable in this position though, as they can reflect market indecision in the current trend.
The second candle in the pattern is arguably the most important. As seen above, this candle is expected to stick out from price action and close as a long blue candle. This large move in price signals a return to a bullish market bias with newupward price momentum surging towards higher highs. To be considered a complete bullish engulfing candle pattern, the high of this blue candle should close well above the high of the previous candle. The higher this blue candle advances, the stronger our signal is considered. A new push of upward movement in this position on the chart, reflects new buyers overtaking the previous strength of the sellers.This action can be used in conjuncture with an established uptrend,with buyers looking to enter the market on refreshed strength.
Let’s look at a current example :
Charting the EURUSD
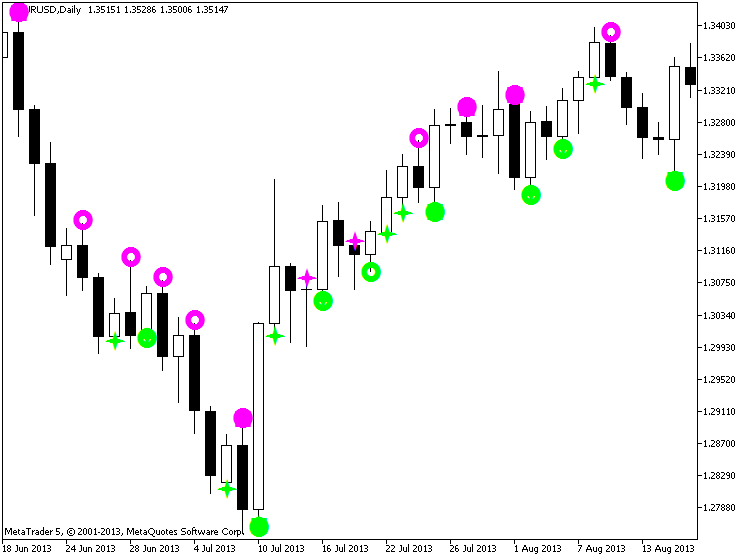
Once you are familiarized with identifying the bullish engulfing candle pattern it can then readily be applied to your trading. Above is an excellent example of the pattern in action on a daily EURUSD chart. The EURUSD is currently in a standing uptrend, beginning with a strong bullish engulfing candle completed on July 10th. Along the way there have been price retracements against this now mature trend, but we can see many of these declines have ended in a fresh bullish engulfing candle. These surges in price have confirmed the resumption of the broader trend, while creating new buying opportunities.
Currently, this scenario may be playing out yet again. Highlighted in green, there is another potential bullish engulfing pattern forming on the EURUSD Daily chart. Traders will be watching this candle for a confirmation to signal the resumption of the bull trend after last week’s decline. If the price of the EURUSD does remain supported, traders should take this as a bullish market signal and look for the pair to move towards higher highs.
Video Futures Trading Course - The Stop Order
===========
How to Protect Profits with Stop-Loss Orders (adapted from futures-investor.co.uk article)
How do Stop-Losses work?Losses can accumulate just as quickly as profits in futures trading. Nearly every successful trader uses Stop-Loss Orders in his trading to ensure profits are 'locked in' and losses are minimised.
A stop-loss is usually placed when a trade is entered, although it can be entered or moved at any time. It is placed slightly below or above the current market price, depending on whether you are buying or selling.
For example, say Pork Bellies is trading at $55.00 and you think prices are about to rise. You decide to buy one Pork Bellies contract, but you don't want to risk more than $800 on the trade. A one-cent move in the market is worth $4.00 on a pork bellies futures contract so, therefore, you would place your stop at $53.00 (200 cents away from the current price x $4 per point = $800).
You can also move a stop-loss order to protect any profits you accumulate.
Taking the Pork Bellies example: Two weeks later, bellies are now trading at $65.00. You are now up $4000 (1000 cents of movement x $4). To protect these profits, you can raise your stop-loss simply by calling your broker. Say you place it at $63.00, you have locked it a profit of at least $3200 and now risk $800 to your new stop level.
But what if the market went against you? Going back to the original position when you bought at $55.00 with a stop at $53.00: what happens if the market suddenly tumbles down to $51.00 during the day? Your trade would automatically be 'stopped out' at your stop level of $53.00 for an $800 loss. The fact that the market closed the day at $51.00 is irrelevant as you are now out of the market. (Had you not used a stop-loss and viewed the market at the end of the day, you would have large losses on your hands!)
The same would happen if the market reached $65.00 and you had raised your stop to $63.00: If the market fell from here, say to $62.80, you would be stopped out at $63.00 and would have a profit of $3200. Even if the market suddenly reversed here and rose to $79.00, this would be irrelevant as you are now out of the market.
This last example would be annoying because if you hadn't been stopped out, you would now be $9600 in profit. But you were stopped out at your $63.00 stop. The market only went 20-cents under this and reversed!
It is for this reason that some traders don't use stops: they have been stopped out in the past JUST when the market was about to go their way.
The solution is not to abandon using stops as this is EXTREMELY RISKY. The solution is to use stops effectively.
(In fast moving markets it is sometimes impossible for brokers to get your orders exited exactly on your stop loss limits. They are legally required to do their best, but if the price in the trading pit suddenly jumps over your limit, you may be required to settle the difference. In the above scenario, the price of Pork Bellies could open trading at $62.50, fifty cents through your stop at $63.00. Your broker would have to exit your trade here and, in fact, you would lose $1000, $200 more than your anticipated $800.)
===========
Reversals with Bollinger Bands
Forum
Indicators: Bollinger Bands ®
newdigital, 2013.08.06 14:04
Bollinger Bands Trend Reversals- Double Tops and Double Bottoms
A Forex trader should wait for the price to turn in the opposite direction after touching one of the bands before considering that a reversal is happening.
Even better one should see the price cross over the moving average.
Double Bottoms Trend Reversals
A double bottom is a buy setup/signal. It occurs when price action penetrates the lower bollinger band then rebounds forming the first low. then after a while another low is formed, and this time it is above the lower band.
The second low must not be lower than the first one and it important is that the second low does not touch or penetrate the lower band. This bullish Forex trading setup is confirmed when the price action moves and closes above the middle band (simple moving average).
Double Tops Trend Reversals
A double top is a sell setup/signal. It occurs when price action penetrates the upper bollinger band then rebounds down forming the first high. then after a while another high is formed, and this time it is below the upper band.
The second high must not be higher than the first one and it important is that the second high does not touch or penetrate the upper band. This bearish Forex trading setup is confirmed when the price action moves and closes below the middle band (simple moving average).
Moving Averages - How to Use Them and Which Ones to Use
Educational segment on using moving averages in your online stock, futures, or forex trading with Toni Hansen
Breakaway Gaps by Toni Hansen
Presented by veteran trader Toni Hansen. Breakaway gaps are an excellent form of gap to watch for when you are trying to locate securities with a high probability of a trend day. They are gaps which break the security out of a trading range or congestion zone and are a much stronger confirmation than a non-gap break out of a range. The gap itself will then serve as support for the security, allowing it to more easily continue in the direction of the gap. True breakaway gaps rarely close in the days immediately following the gap.
Common Gaps by Toni Hansen
The most prevalent type of gap which takes place in the market is called a common gap, for the obvious reason: they are the most abundant. They occur when a security ends the session at one price level and then open the following session at another price level. Common gaps tend form when a security is trading within a range and tend to fill rather quickly and easily. They are usually relatively minor, representing only a small percentage of an average days range.