How to make objects drawn by XY change smoothly (MT4 vs MT5)
Help solve a problem on the MT5 terminal.
Decided to transfer my product from mql4 to mql5.
It uses rectangles that are drawn on XY coordinates.
In MT4 it is all smooth and without jerks when changing vertical scale, but in MT5 the same approach leads to some freezes and noticeable "non-smoothness".
I specially made a simplified prototype to demonstrate the effect. It is the same for MT4 and MT5. Compare the difference when you change the vertical scale (with a mouse on the price scale).
In MT5 everything will be without brakes, but redrawing is jerky. The more objects, the worse. But in MT4 everything is smooth.
I attach source mq4 and mq5 files and paste mq5 code.
Please help me to make it smooth.
I want to understand: is it "such and such" MT5 or "such and such" my code for MT5.
I have been trying to prove to MQ for years that these functions should not be asynchronous, because the chart property table already exists and it is enough to just take those properties and there is no point in running an asynchronous process.
But all efforts are in vain.
This really reeks of idiocy.
I know what I'm talking about, because I'm programming in many languages including Kanvas and actively using event-driven model.
And in prehistoric MQL4 this problem is minimal.
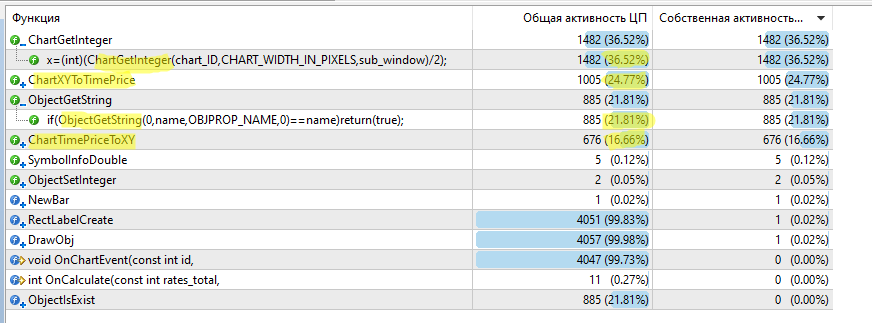
Yeah, you've got 4 asynchronous functions that take 99.76% of all time.
...
And in prehistoric MQL4 this problem is minimal.
Yes, everything flies in MT4.
If you don't mind, can you give me an example of how to do it better?
Yes, everything flies in MT4.
If you don't mind, can you give me an example of how to do it more intelligently?
The shortest way is to attach my iCanvas biblio, which will allow not to use asynchronous functions in loop.
You don't have to use canvas itself. It will hang in your chart for the whole thing, but it will be empty and transparent.
If a longer method without using iCanvas, then you'll have to look it up in this bible again, as it is implemented there, but it's not for the faint-hearted. :))
I will try to briefly explain what iCanvas does.
It has internal handlerOnChartEvent, which catchesCHARTEVENT_CHART_CHANGE event and fills its internal structure W, using all the same asynchronous ChartGet functions, but does it only once with occurrence of this event.
This allows more or less optimize speed.
Also in this library hangs Canvas object, which stretches the entire screen and adjusts to it when screen changes.
Here, for example, three lines of code have been added and many lines discarded:
#property indicator_chart_window
#include <Canvas\iCanvas.mqh> //https://www.mql5.com/ru/code/22164

#property indicator_buffers 0
#property indicator_plots   0


string obj_name = "Asd_";

//+------------------------------------------------------------------+
//| Custom indicator initialization function                         |
//+------------------------------------------------------------------+
int OnInit() {
   return(INIT_SUCCEEDED);
}
//+------------------------------------------------------------------+
//| Custom indicator iteration function                              |
//+------------------------------------------------------------------+
int OnCalculate(const int rates_total,
                const int prev_calculated,
                const datetime &time[],
                const double &open[],
                const double &high[],
                const double &low[],
                const double &close[],
                const long &tick_volume[],
                const long &volume[],
                const int &spread[]) {
   if(NewBar()) {
      DrawObj();
   }
   return(rates_total);
}
//+------------------------------------------------------------------+
//| ChartEvent function                                              |
//+------------------------------------------------------------------+
void OnChartEvent(const int id,
                  const long &lparam,
                  const double &dparam,
                  const string &sparam) {
   if(id == CHARTEVENT_CHART_CHANGE) {
      DrawObj();
   }
}
//+------------------------------------------------------------------+
//| Выводим на график                                                |
//+------------------------------------------------------------------+
void DrawObj() {
   string GenName = obj_name;
   double startPricePos = SymbolInfoDouble(Symbol(),SYMBOL_BID);
   int step_Pips = 50;
   for(int i=1; i<=20; i++) {
      double stp = (step_Pips*i)*SymbolInfoDouble(Symbol(),SYMBOL_POINT);
      RectLabelCreate(GenName+"UP_"+IntegerToString(i),startPricePos + stp);
      RectLabelCreate(GenName+"DN_"+IntegerToString(i),startPricePos - stp);
   }
   ChartRedraw(0);
}
//+------------------------------------------------------------------+
//| Создает прямоугольную метку                                      |
//+------------------------------------------------------------------+
void RectLabelCreate(string name,   // имя метки
                     double price   // цена
                    ) {
   const long  chart_ID=0;               // ID графика
   int         sub_window=0;             // номер подокна
   int         x=0;                      // координата по оси X
   int         y=0;                      // координата по оси Y
   x=W.Width/2;
   y = Round(Canvas.Y(price));
   //x=(int)(ChartGetInteger(chart_ID,CHART_WIDTH_IN_PIXELS,sub_window)/2);
   //ChartXYToTimePrice(chart_ID,x,y,sub_window,time_pos_X_centr,price_pos_Y_tmp);
   //ChartTimePriceToXY(chart_ID,sub_window,time_pos_X_centr,price,x,y);
   const int              width=50;                 // ширина
   const int              height=10;                // высота
   const color            back_clr=C'236,233,216';  // цвет фона
   const ENUM_BORDER_TYPE border=BORDER_SUNKEN;     // тип границы
   const ENUM_BASE_CORNER corner=CORNER_LEFT_UPPER; // угол графика для привязки
   const color            clr=clrRed;               // цвет плоской границы (Flat)
   const ENUM_LINE_STYLE  style=STYLE_SOLID;        // стиль плоской границы
   const int              line_width=1;             // толщина плоской границы
   const bool             back=false;               // на заднем плане
   const bool             selection=false;          // выделить для перемещений
   const bool             hidden=true;              // скрыт в списке объектов
   const long             z_order=0;                // приоритет на нажатие мышью
   if(ObjectCreate(chart_ID,name,OBJ_RECTANGLE_LABEL,sub_window,0,0)) {
      ObjectSetInteger(chart_ID,name,OBJPROP_XDISTANCE,x);
      ObjectSetInteger(chart_ID,name,OBJPROP_YDISTANCE,y);
      ObjectSetInteger(chart_ID,name,OBJPROP_XSIZE,width);
      ObjectSetInteger(chart_ID,name,OBJPROP_YSIZE,height);
      ObjectSetInteger(chart_ID,name,OBJPROP_BGCOLOR,back_clr);
      ObjectSetInteger(chart_ID,name,OBJPROP_BORDER_TYPE,border);
      ObjectSetInteger(chart_ID,name,OBJPROP_CORNER,corner);
      ObjectSetInteger(chart_ID,name,OBJPROP_COLOR,clr);
      ObjectSetInteger(chart_ID,name,OBJPROP_STYLE,style);
      ObjectSetInteger(chart_ID,name,OBJPROP_WIDTH,line_width);
      ObjectSetInteger(chart_ID,name,OBJPROP_BACK,back);
      ObjectSetInteger(chart_ID,name,OBJPROP_SELECTABLE,selection);
      ObjectSetInteger(chart_ID,name,OBJPROP_SELECTED,selection);
      ObjectSetInteger(chart_ID,name,OBJPROP_HIDDEN,hidden);
      ObjectSetInteger(chart_ID,name,OBJPROP_ZORDER,z_order);
   } else Print(_LastError);
}
//+------------------------------------------------------------------+
//|                                                                  |
//+------------------------------------------------------------------+
bool NewBar() {
   static int countLastBar=0;
   int curBars = iBars(Symbol(),PERIOD_CURRENT);
   bool flg = false;
   if(countLastBar!=curBars) {
      countLastBar=curBars;
      flg=true;
   }
   return(flg);
}
//+------------------------------------------------------------------+
In any case, you can increase the number of objects with this algorithm and it won't affect performance too much.
Or maybe it is not a bug but a feature? Something there is optimized with graphics. And it works badly because it is desirable to use all things for their intended purpose. There are specialized graphical objects which are tied to price coordinates - so they should be used for this task.
I used to think so too, until I gained more knowledge on the subject.
The reason is unambiguous - under-thinking.
Some "authority" made a mistake in the beginning (about 10 years ago) and no one still thinks that he could have made a mistake.
https://www.mql5.com/ru/forum/1111/page2780#comment_16886162
They even seem to have agreed and promised to improve it, but no - it's over. It's still there.
https://www.mql5.com/ru/forum/1111/page2781#comment_16904132

The shortest way is to attach my iCanvas bibblet, which will allow you to avoid using asynchronous functions in the loop.
You don't have to use the canvas itself at all. It will hang in your chart for the whole thing, but it will be empty and transparent.
If a longer way without using iCanvas, then you'll have to look it up in this bible again, as it is implemented there, but it's not for the faint-hearted. :))
I will try to briefly explain what iCanvas does.
It has internal handlerOnChartEvent, which catchesCHARTEVENT_CHART_CHANGE event and fills its internal structure W, using all the same asynchronous ChartGet functions, but does it only once with occurrence of this event.
This allows more or less optimize speed.
Also in this library hangs Canvas object, which stretches the entire screen and adjusts to it when screen changes.
Here, for example, three lines of code have been added and many lines discarded:
Thanks for a similar solution to the problem. Indeed, the rendering speed has increased. Looks like I'll have to master the library.
I also would like to specify the following nuance. It compiles with this formulation with a warning:
y = Canvas.Y(price);
And it compiles with this one without a warning, but the speed is a bit slower.
y = (int)Canvas.Y(price); What is more correct?)
Thank you for this kind of solution to the problem. Indeed, the rendering speed has improved. Looks like I'll have to learn the library.
I would also like to clarify the following nuance. It compiles with this formulation with a warning:
And it compiles with this one without a warning, but the speed is a bit slower.
What's more correct?)
What type of "y" do you have?
because if int and objectively"speed drops a bit" this is a BAG
- Free trading apps
- Over 8,000 signals for copying
- Economic news for exploring financial markets
You agree to website policy and terms of use
Help solve a problem on the MT5 terminal.
Decided to transfer my product from mql4 to mql5.
It uses rectangles that are drawn on XY coordinates.
In MT4 it is very smooth and without jerks when changing vertical scale, but in MT5 the same approach leads to some freezes and noticeable "non-smoothness".
I specially made a simplified prototype to demonstrate the effect. It is the same for MT4 and MT5. Compare the difference when you change the vertical scale (with a mouse on the price scale).
In MT5 everything will be without brakes, but redrawing is jerky. The more objects, the worse. But in MT4 everything is smooth.
I attach source mq4 and mq5 files and paste mq5 code.
Please help me to make it smooth.
I want to understand: "this is" MT5 or "this is" my code for MT5.