How to compare different indicators with different scales when programming?
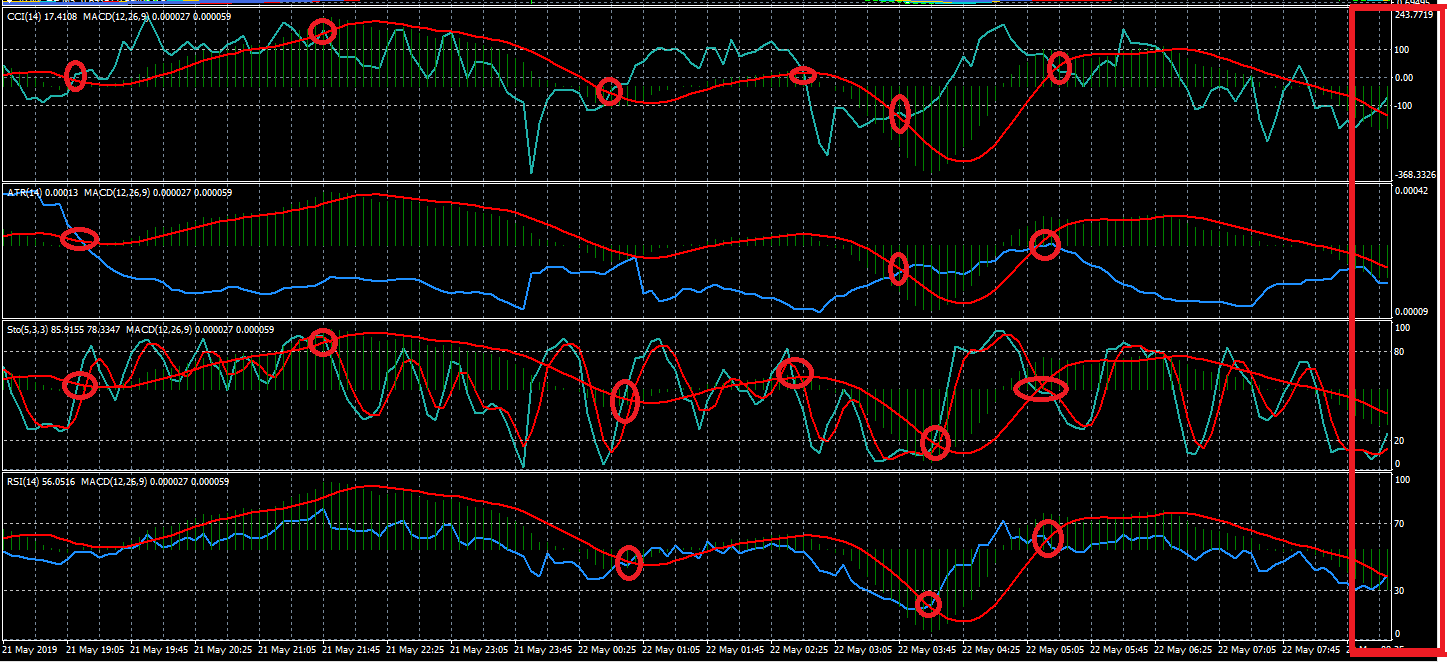
Yes, I Know that... but that is not the problem. The problem is the difference in scales. When you see the indicator in metatrader there is no problem (the program resize the indicators for you), but the function iMACD() for example is going to to return a value un in the MACD escale that is not the same in the ATR scale. And then the lines are not the same like in the image. Look the right side in the image i attached (Red rectangle).
Thank you so much
- MACD and CCI have no limits, Stochastic and RSI do.
- They have different scales, it make no sense to compare them. How do you compare 60 MPH and latitude 30? Non-sense. Think about what you want.
- Perhaps you can count MACD>0 + CCI > 0 + ATR > SMA(ATR) + RSI > 0.5.
- MACD and CCI have no limits, Stochastic and RSI do.
- They have different scales, it make no sense to compare them. How do you compare 60 MPH and latitude 30? Non-sense. Think about what you want.
- Perhaps you can count MACD>0 + CCI > 0 + ATR > SMA(ATR) + RSI > 0.5.
Yes I agree. I know that (to give an example) five kilometers is not the same thing as five apples.
But if there are five things after all. So you can measure things that are apparently different when you use a scale factor that relates the two different units of measure (apples per kilometer). Although it does not make to much sense, what is important is that it be useful. In fact, Metatrader does it (you can see it in the photo attached).
I see it easy when the indicator has limits. But in the case of a non-limits indicator i don't know what to do...
So i was thinking maybe exist a method to do it because the Metratrider developers did it.
But at the moment I have no choice, only do it in the way you have indicated to me....
If you look at the graphics, the crossings of lines between indicators sometimes give you very good inputs and outputs to the market. (at least in Backtesting).
Thank you very much Mr. William
- Free trading apps
- Over 8,000 signals for copying
- Economic news for exploring financial markets
You agree to website policy and terms of use
I want to know when some lines of certain indicators cross each other to implement it in my programming codes. (I attach a photo).
But the problem that I see is that the indicators are designed at different scales. And the MACD that has no limits (the most important to me).