ZigZag Construction
Read this thread from the beginning (just several first posts):
How do i use the inputs for the ZigZag Indicator?
The thread is very old one (for MT3) but it gived some idea about how zigzag indicator works (and how it was built for example).
----------------
- The power of ZigZag (part I). Developing the base class of the indicator - the article (MT5)
- The power of ZigZag (part II). Examples of receiving, processing and displaying data - the article (MT5)
----------------

- 2006.02.10
- www.mql5.com
For MT4 -
Forum on trading, automated trading systems and testing trading strategies
Sergey Golubev, 2018.06.25 07:57
How to use ZigZag custom indicator in an EA - the thread
How to call zigzag inidcator in ea? - thread
============
Forum on trading, automated trading systems and testing trading strategies
Sergey Golubev, 2007.02.26 14:52
Usually zigzag is used as a filter. But zigzag is not simpe indicator. You may read it here:
Interpretation
The Zig Zag indicator is used primarily to help you see changes by punctuating the most significant reversals. It is very important to understand that the last "leg" displayed in a Zig Zag chart can change based on changes in the underlying plot (e.g., prices). This is the only indicator in this book where a change in the security's price can change a previous value of the indicator. Since the Zig Zag indicator can adjust its values based on subsequent changes in the underlying plot, it has perfect hindsight into what prices have done. Please don't try to create a trading system based on the Zig Zag indicator--its hindsight is much better than its foresight! In addition to identifying significant prices reversals, the Zig Zag indicator is also useful when doing Elliot Wave counts.
For additional information on the Zig Zag indicator, refer to Filtered Waves by Arthur Merrill.
and:
Elliott Wave Theory
The Elliott Wave Theory is named after Ralph Nelson Elliott. Inspired by the Dow Theory and by observations found throughout nature, Elliott concluded that the movement of the stock market could be predicted by observing and identifying a repetitive pattern of waves. In fact, Elliott believed that all of man's activities, not just the stock market, were influenced by these identifiable series of waves. With the help of C. J. Collins, Elliott's ideas received the attention of Wall Street in a series of articles published in Financial World magazine in 1939. During the 1950s and 1960s (after Elliott's passing), his work was advanced by Hamilton Bolton. In 1960, Bolton wrote Elliott Wave Principle--A Critical Appraisal. This was the first significant work since Elliott's passing. In 1978, Robert Prechter and A. J. Frost collaborated to write the book Elliott Wave Principle.
Interpretation
The underlying forces behind the Elliott Wave Theory are of building up and tearing down. The basic concepts of the Elliott Wave Theory are listed below. Action is followed by reaction. There are five waves in the direction of the main trend followed by three corrective waves (a "5-3" move). A 5-3 move completes a cycle. This 5-3 move then becomes two subdivisions of the next higher 5-3 wave. The underlying 5-3 pattern remains constant, though the time span of each may vary. The basic pattern is made up of eight waves (five up and three down) which are labeled 1, 2, 3, 4, 5, a, b, and c on the following chart. Waves 1, 3, and 5 are called impulse waves. Waves 2 and 4 are called corrective waves. Waves a, b, and c correct the main trend made by waves 1 through 5. The main trend is established by waves 1 through 5 and can be either up or down. Waves a, b, and c always move in the opposite direction of waves 1 through 5. Elliott Wave Theory holds that each wave within a wave count contains a complete 5-3 wave count of a smaller cycle. The longest wave count is called the Grand Supercycle. Grand Supercycle waves are comprised of Supercycles, and Supercycles are comprised of Cycles. This process continues into Primary, Intermediate, Minute, Minuette, and Sub-minuette waves.
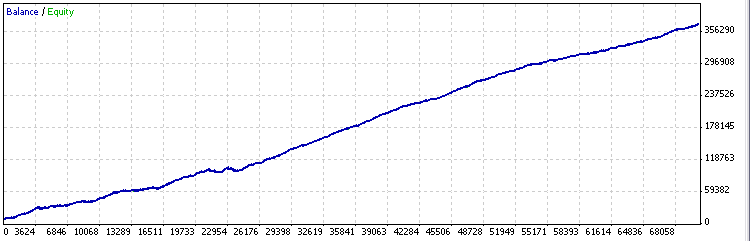
As to me so I used zigzag in more simple way in Channel trading system: when I am losing money in manual trading so I start to trade channel trading system to recover deposit size https://www.mql5.com/en/forum/173261
CodeBase (EAs based on zigzag indicator):
Forum on trading, automated trading systems and testing trading strategies
Sergey Golubev, 2018.04.10 16:07
- ZigZag For Long Term - expert for MetaTrader 4
- Random ZigZaG - expert for MetaTrader 4
- The adviser on the indicator ZigZag - expert for MetaTrader 4
- Fibo Retracement Trader - expert for MetaTrader 5
- DoubleZigZag - expert for MetaTrader 5
- ZigZagEvgeTrofi ver. 1 - expert for MetaTrader 5
- Last ZZ50 - expert for MetaTrader 5
- FMOneEA - expert for MetaTrader 4
- Aver4Sto+Postzigzag(Set-up for USDJPY only) - expert for MetaTrader 4
- e_RP_250 - expert for MetaTrader 5
- On the MaZi - expert for MetaTrader 4
- FX-CHAOS_SCALP - expert for MetaTrader 4
- Fractal ZigZag Expert - expert for MetaTrader 4

Is there any non-repainting indicator?

- 2012.10.27
- www.mql5.com
And finally -
Forum on trading, automated trading systems and testing trading strategies
Sergey Golubev, 2021.07.12 15:17
Technical Analysis from A to Z
by Steven Achelis
Millions of traders participating in today’s financial markets have shot interest and involvement in technical analysis to an all-time high. This updated edition of Technical Analysis from A to Z combines a detailed explanation of what technical analysis is and how it works with overviews, interpretations, calculations, and examples of over 135 technical indicators—and how they perform under actual market conditions. Enhanced with more details to make it easier to use and understand, this book reflects the latest research findings and advances. A complete summary of major indicators that can be used in any market, it covers:
• Every trading tool from the Absolute Breadth Index to the Zig Zag
• Indicators include Arms Index, Dow Theory, and Elliott Wave Theory
• Over 35 new indicators
- Free trading apps
- Over 8,000 signals for copying
- Economic news for exploring financial markets
You agree to website policy and terms of use