Something Interesting in Financial Video June 2017
Candlestick Charting - Bullish Engulfing Pattern
Candlestick Charting - Bullish Engulfing Pattern
Video Manual: Non-farm Payrolls
Non-farm Payrolls is the assessment of the total number of employees recorded in payrolls.
This is a very strong indicator that shows the change in employment in the country. The growth of this indicator characterizes the increase in employment and leads to the growth of the dollar. It is considered an indicator tending to move the market. There is a rule of thumb that an increase in its value by 200,000 per month equates to an increase in GDP by 3.0%.
- Release Frequency: monthly.
- Release Schedule: 08:30 EST, the first Friday of the month.
- Source: Bureau of Labor Statistics, U.S. Department of Labor.
=====
- Source : Bureau of Labor Statistics
- Measures : Change in the number of employed people during the previous month, excluding the farming industry
- Usual Effect : Actual > Forecast = Good for currency
- Frequency : Released monthly, usually on the first Friday after the month ends
- Why Traders Care : Job creation is an important leading indicator of consumer spending, which accounts for a majority of overall economic activity
- Also Called : Non-Farm Payrolls, NFP, Employment Change
=====
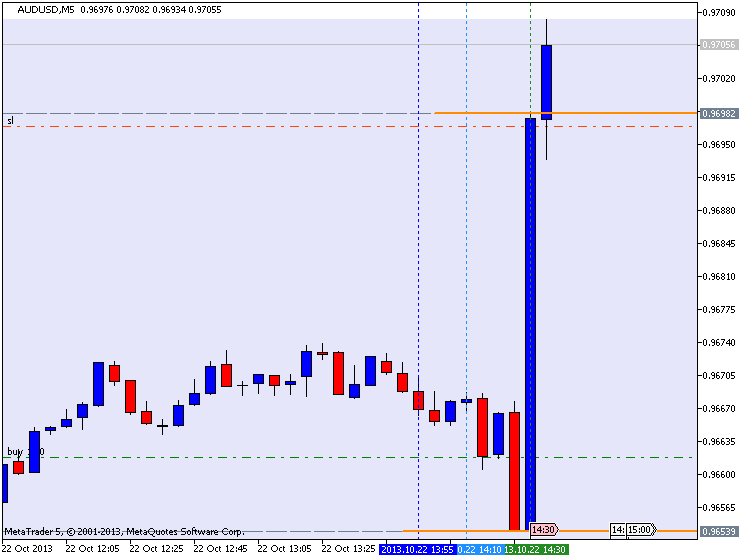
AUDUSD M5 with 45 pips in profit (by equity) for NFP :
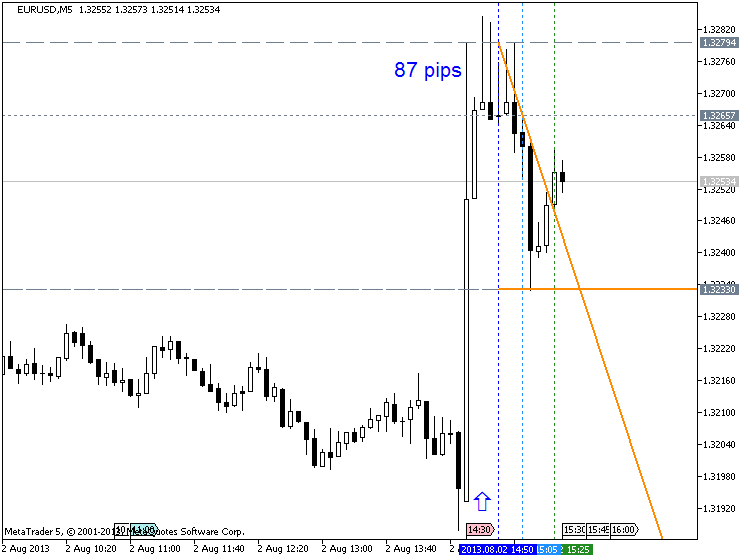
EURUSD M5 : 87 pips price movement by NFP news event :
EUR/USD - The Most Popular Currency in Forex
EUR/USD is the most widely traded currency pair in the forex trading market accounting for some 50% of trades. This implies the tightest spreads and may hence be one of the better cross pairs to start trading. The pair is fairly volatile and can reasonably move in 50 to 60pts even when there's nothing going on. Obviously news from the Eurozone or the USA economy always will move this pair.
Six Currencies in Six Minutes as a Practical Example
International trade currencies: These currencies are heavily influenced by changes in global demand for raw materials (commodities) and finished goods. A few of them (CAD, AUD, NZD) are often referred to as the “commodity currencies.” Currently the GBP, AUD and NZD also have very high target interest rates in their economies and are therefore also very sensitive to changes in the forces behind capital flows such as interest rates, the credit market and yields.
- GBPUSD
- AUDUSD
- NZDUSD
- USDCAD
- USDJPY
Capital flow currencies: These currencies are heavily influenced by changes in demand for investments including equities, bonds and interest bearing investments. You will notice that there are some currencies that overlap. This is not accidental. It is impossible to rigidly define them.
- EURUSD
- GBPUSD
- USDCHF
- USDJPY
In this video, Greg Michalowski, reviews the technicals for six major currency pairs in six minutes. Included are the:
- EURUSD,
- USDJPY,
- GBPUSD,
- USDCAD,
- AUDUSD and
- NZDUSD.
A Trader's Introduction to the Yen
Japan has the second largest economy in the world behind the United States, and an economic history that is the starting point for understanding the fundamentals of the Yen. The first thing that it is important to understand from a fundamental standpoint about the Japanese economy, is that unlike the United States, Japan has very few natural resources. As a result of this, prior to World War II, Japan had a large military force, which it used to occupy Korea, Taiwan, and parts of China. The country saw this as necessary, because of the vulnerable position that its lack of natural resources would have otherwise put it into.
Like with Europe however, World War II, set the country back considerably from an economic standpoint, as according to wikipedia.org, 40% of its industrial plants and infrastructure were destroyed. While no one would obviously wish for that type of destruction, there was actually a silver lining in this for the Japanese Economy. As so much of their infrastructure had been destroyed, this gave the Japanese the ability to upgrade it significantly, ultimately giving them an edge over victor states, who now had much older factories.
After World War II the United States occupied Japan, which resulted in the building of a democratic nation, that was dominated by industry, instead of the military. As the Japanese were now putting all of the focus, which had before been put into the military, into rebuilding their industries, they were able to not only match their pre war production levels by 1950, but surpass them. In the decades that followed Japan proved very competitive on the international stage, and its economic growth in the 60's, 70's and 80's has been described as nothing short of astonishing.
If you were around living in the US during the 80's, you can probably remember the envy and fear among the US population, that Japan was quickly going to overcome the United States as the world's economic power house.
While I don't think there is any question that the quality of Japanese products and services has remained very high since the 80's, unfortunately Japan's economy derailed in the early 1990's, culminating in the busting of one of the most famous asset price bubbles in history.
In the decades following World War II the Japanese population had one of the highest savings rates in the world. As more money was being saved, this meant there was more money available for investment, making access to credit much easier than it had been in the past. As Japan's economy was and still is an export oriented economy, the value of the currency also went up dramatically during this time. The combination of a strong economy, easy access to credit, and a strengthening currency made Japanese assets especially attractive.
As its economy seemed unstoppable, and newly wealthy Japanese saved more and more money, much of that capital flowed into the stock and real estate markets. As you can see from this chart the stock market roared through the 1980s, almost quadrupling in value in 5 years. In the most expensive districts, according to wikipedia.org, real estate prices reached as high as $139,000 per square foot.
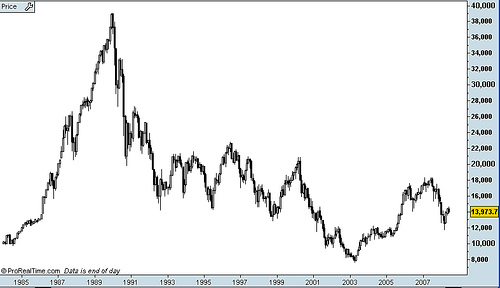
From the high of the stock and real estate markets in 1990, both markets made a slow and painful decline. It took until 2003 for the stock market to finally bottom, down from a top of around 39,000 to a bottom of around 7600. According to wikipedia.org, prices for the most expensive commercial real estate properties stood at 1/100th of their pre bubble bursting peak, and $20 Trillion in wealth had been wiped out in the stock and real estate markets.
While this may seem like a history lesson that is not relevant to traders, as we will learn in tomorrow's lesson, the affects of Japan's asset price bubble on the Yen are still being felt today, and therefore an understanding is necessary to know how today's market will react to different fundamental events.
How To Swing Trade Stocks
How To Trade Descending Triangle Chart Patterns
Forum on trading, automated trading systems and testing trading strategies
Sergey Golubev, 2013.11.13 07:42
How to Trade a Descending Triangle
Talking Points
- Triangle price patterns can be used in Forex trading to identify potential breakout setups
- Descending triangles form when a rising trend line and a horizontal support line converge
- Traders can look for the breakout from the descending triangle to signal the continuation of the AUDJPY down move.
===============
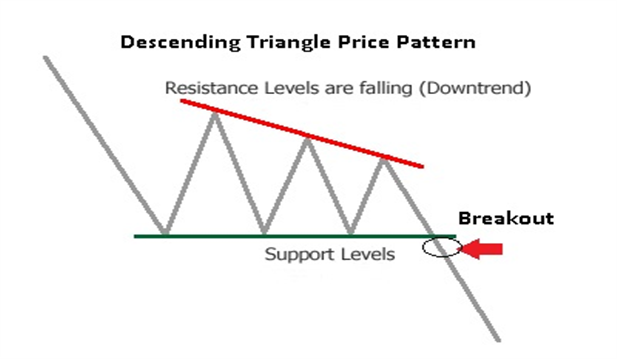
What is a Descending Triangle pattern?
A descending triangle pattern is consolidation price pattern composed of
lower swing highs pushed lower by an established downtrend line
converging with a horizontal support made up of a series of swing lows
located in roughly the same area. Another name for the descending
triangle is the right triangle pattern due to its similarity to the
geometric shape of the same name. The height of the triangle meets the
horizontal support at a 90 degree angle.
Usually, descending triangles form as profit taking by sellers is met
with bargain hunting buyers. However, the buying pressure is mutted as
higher lows are not made. A news release or economic announcement could
be the catalyst required to push price out of this coil tilting the
balance strongly in the seller's favor. Unlike its cousins, the
symmetrical triangle and ascending triangle, the descending lacks
significant bullish participation indicated by that lack of higher lows.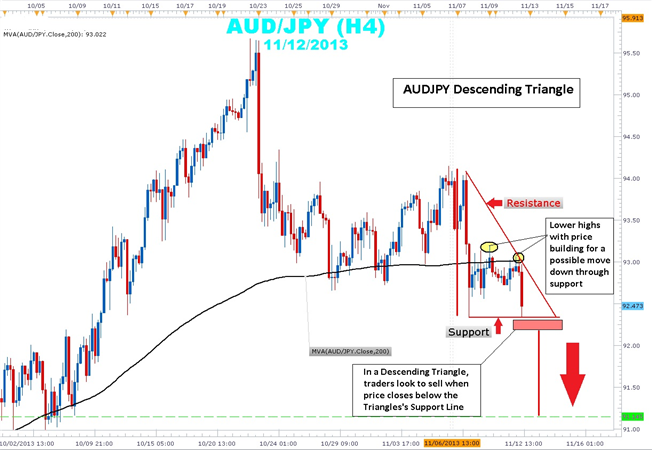
Taking a look at the current AUDJPY 4-hour chart, you can clearly see
price action bound between a descending trend line that connects the
11/6 swing high of 94.15 to 11/12 swing high of 93.05. This swing high
is a lower swing high than the 11/10 93.19 swing high showing the
building strength in the downtrend. Current price action within the
triangle is below the 200 simple moving average (SMA), a key indicator
that traders use to determine bullishness or bearishness.
Traders will watch price action for a 4-hour candle close below support
to confirm that there is follow through in a potential breakout. Stops
can be placed near the middle of the triangle just above the 93.00 and
200 SMA. The height of the triangle is a little over 170 pips. By
extending this height from the support level of a potential breakout
zone, look for a possible target of 91.14. The profit target coincides
with the lows seen back on October 2nd.
In summary, descending triangles can be an excellent way to rejoin a
downtrend that clearly illustrates risk and reward. Price has a tendency
to break form the descending triangle in a downward direction.
Trading The Martingale and Anti Martingale Strategies
In today's lesson we are going to look at the two categories that most position sizing strategies fall into which are known as martingale strategies and anti martingale strategies.
A position sizing strategy which incorporates the martingale technique is basically any strategy which increases the trade size as a trade moves against the trader or after a losing trade. On the flip side a position sizing strategy which incorporates the anti martingale technique is basically any strategy which increases the trade size as the trade moves in the traders favor or after a winning trade.
The most basic martingale strategy is one in which the trader trades a set position size at the beginning of his trading strategy and then double's the size of his trades after each unprofitable trade, returning back to the original position size only after a profitable trade. Using this strategy no matter how large the string of losing trades a trader faces, on the next winning trade they will make up all their losses plus a profit equal to the profit on their original trade size.
As an example lets say that a trader is using a strategy on the full size EUR/USD Forex contract that takes profits and losses both at the 200 point level (I like using the EUR/USD Forex contract because it has a fixed point value of $1 per contract for mini forex contracts and $10 per contract for full sized contracts but the example is the same for any instrument)
The trader starts with $100,000 in his account and decides that his starting position size will be 3 contracts (300,000) and that he will use the basic martingale strategy to place his trades. Using the below 10 trades here is how it would work.
As you can see from the example although the trader was down significantly going into the 10th trade, as the 10th trade was profitable he made up all the his losses plus a brought the account profitable by the equity high of the account plus original profit target of $6000.
At first glance the above method can seem very sound and people often point to their perception that the chances of having a winning trade increase after a string of loosing trades. Mathematically however the large majority of strategies work like flipping a coin, in that the chances of having a profitable trade on the next trade is completely independent of how many profitable or unprofitable trades one has leading up to that trade. As when flipping a coin no matter how many times you flip heads the chances of flipping tails on the next flip of the coin are still 50/50.
The second problem with this method is that it requires an unlimited amount of money to ensure success. Looking at our trade example again but replacing the last trade with another loosing trade instead of a winner, you can see that the trader is now in a position where, at the normal $1000 per contract margin level required, he does not have enough money in his account to put up the necessary margin which is required to initiate the next 48 contract position
So while the pure martingale strategy and variations of it can produce successful results for extended periods of time, as I hope the above shows, odds are that it will eventually end up in blowing ones account completely.
With this in mind the large majority of successful traders that I have seen follow anti martingale strategies which increase size when trades are profitable, never when unprofitable.
- www.metatrader5.com
A Trader's Introduction to the British Pound
This video is on the British pound, its history, and what traders should know about it before trading the GBP.
- Free trading apps
- Over 8,000 signals for copying
- Economic news for exploring financial markets
You agree to website policy and terms of use
Please upload forex video you consider as interesting one. No direct advertising and no offtopic please.
The comments without video will be deleted.