Simple Ichimoku System - rules for the systems - page 2
You are missing trading opportunities:
- Free trading apps
- Over 8,000 signals for copying
- Economic news for exploring financial markets
Registration
Log in
You agree to website policy and terms of use
If you do not have an account, please register
Ichimoku alert indicator with arrows (attached, for MT5): the theory of the signals and how to use
============
Explanation of the settings.
1. Ichimoku settings. As I said - this 9/26/52 is for timeframe started with H1 for example, for lower timeframe - I am suggesting to use 72/144/288
2. Arrows on the chart
SignalMode = 4; // Signal Mode: 0-off, 1-Tenkan/Kijun, 2-Chinkou/Cloud, 3-Chinkou/Price, 4-all together
How to know which arrows for which signal? Move mouse on the arrow and you will see the text with description concerning what this arrow is about.
3. Alerts (on close bar)
AlertMode = 4; // Alert Mode: 0-off, 1-Tenkan/Kijun, 2-Chinkou/Cloud, 3-Chinkou/Price, 4-all together
I tested some of those alerts and it works.
4. WarningMode = 1; // Warning Mode: 0-off,1-on
This is alerts on open bar as a warning about 'crossing will be soon'.
============
============
There are 2 kinds of settings:
Besides, there are many signals of Ichimoku indicator to open the trades. I know about 6 signals (but it is much more signals in combination with each other):
The combination of all those 6 signals = Ichimoku indicator.
============
============
Ichimoku
The beginning
After
============
New EA was created for MT5: ichimok2005 - expert for MetaTrader 5
Video -
Forum on trading, automated trading systems and testing trading strategies
Financial and trading videos - Table of Contents
Alain Verleyen, 2013.10.02 16:02
Indicators.
Stop loss and take profit.
Do not trade without stop loss. Especially if trading D1 or H4 timeframe. Stop loss value is the price of nearest dot or arrow (in most of the cases), or nearest support/resistance line (most often - borer of the cloud).
I am using price of dot/arrow for stop loss in most of the cases. Stop loss is not small by value for D1/H4 timeframe as we can see from the charts so we should have initial deposit enough to trade those timeframes.
Stop loss is moved by trailing stop. In my trades in the beginning of this thread I used trailing stop as 30 - 50 pips (4 digit pips). But in reality - it should be not less then 50. Stop loss should not be moved by trailing stop in aggressive way, especially on D1 timeframe. Let the profit run.
So, the trade may be closed by stop loss (moved by trailing stop). Or we can close the trade if price will touch/cross some support/resistance line (usually - border of the cloud) if we do not want to trade inside the cloud in ranging unpredictable market condition.
Classical Ichimoku indicator's stop los and take profit values suggested by the author of this indicator (Ichimoku Sanjin):
- if we are trading on the direction of the cloud so take profit values are Senkou Span A and Senkou Span B lines. Stop loss in case case can be somewhere outside the trend, or we can use Parabolic SAR indicator (Ichimoku Sanjin suggested Parabolic SAR indicator for stop loss in this case).
- if we are trading from the cloud so our stop loss should be somewhere near Kijun-sen line, next stop - Senkou Span A and Senkou Span B lines (borders of the cloud). Take profit in this case: Kijun-sen line reversal, or - how suggested the author of Ichimoku indicator - fix take profit value.
Generally - we can have 1 or 2 signals per 2 weeks per pair. And generally - we can have 100 - 300 pip (4 digit pips) per pair in a month (for D1 timeframe). It is just an averaging stats decribing by some traders.
Trading inside the cloud is one of the good trading technique to use this indicator. In this case the borders of the cloud (Senkou Span A and Senkou Span B) are support/resistance lines and some guiding lines for stop loss and take profit values (should be behind those lines), and we are trading on the direction of Tenkan-sen line inside the cloud in the ame way as we are trading inside the channel. Some traders are having the avegaring profit days as 40 pips (4 digit pips) just using this technique only.
But we all understand that in this case - the cloud should be big enough to indicate the ranging market condition. We can not use this technique in case of small cloud (flat).
Some traders stimated some stats for stop loss and take profit values for Ichimoku systems. We can use it for this system as some recommendations for example:
Stop loss (4 digit price pips):
- For M5 ... H1: some traders are using stop loss = 15 pips for all the pairs in any situation. Not for H4, D1 and W1.
- For H1 (in case we are trading on H1 timeframe):15 - 30 pips for EURUSD; 20 - 40 pips for GBPUSD; 35 - 50 pip for USDJPY; 30 - 80 for USDCHF.
- for H4, D1 and W1 timeframes: near the most strongest indicator's line or signal. For D1 it can be 100 or 200 pips.
- for H4, D1 and W1 timeframes: behind the cloud.
- for any timeframe: dot or arrow of PriceChannel_Signal indicator.
- For H1 (in case we are trading on H1 timeframe):15 - 30 pips for EURUSD; 20 - 40 pips for GBPUSD; 35 - 50 pip for USDJPY; 30 - 80 for USDCHF.
what is ideal stop loss range for CAD,NZD,AUD pairs and Metals (gold and silver).
Forum on trading, automated trading systems and testing trading strategies
Gold is Reaching at 1270
Sergey Golubev, 2013.07.01 21:04
How can we know: correction, or bullish etc (in case of using indicator for example)?
well ... let's take AbsoluteStrength indicator from MT5 CodeBase.
bullish (Bull market) :
bearish (Bear market) :
ranging (choppy market - means: buy and sell on the same time) :
flat (sideways market - means: no buy and no sell) :
correction :
correction in a bear market (Bear Market Rally) :
Forum on trading, automated trading systems and testing trading strategies
Gold is Reaching at 1270
Sergey Golubev, 2013.07.01 21:43
red lines are for sell (sell lines), blue lines are for buy (buy lines). So, bullish (uptrend) and bearish (downtrend) are separated by color of the lines in this indicator. Buy is main blue line is above blue signal line and both are in uptrend. If "sell within no buy" - this is correction (opposite for rally). if "no buy" and "no sell" - this is flat.Forum on trading, automated trading systems and testing trading strategies
How to Start with Metatrader 5
Sergey Golubev, 2016.08.12 17:07
Indicator from the post above? Blue lines (signal line and the dotted line) are the bullish. The combination of those lines are providing the information about the primary trend (bullish only), and the secondary trend. Red lines (2 lines) are for bearish.
Hi Sergy. I cant get the mq5 file in this thread to compile. Keeps giving me an error. Any idea what the problem is. Thanks
Ichimoku alert indicator with arrows (attached, for MT5): the theory of the signals and how to use
============
Explanation of the settings.
1. Ichimoku settings. As I said - this 9/26/52 is for timeframe started with H1 for example, for lower timeframe - I am suggesting to use 72/144/288
2. Arrows on the chart
SignalMode = 4; // Signal Mode: 0-off, 1-Tenkan/Kijun, 2-Chinkou/Cloud, 3-Chinkou/Price, 4-all together
How to know which arrows for which signal? Move mouse on the arrow and you will see the text with description concerning what this arrow is about.
3. Alerts (on close bar)
AlertMode = 4; // Alert Mode: 0-off, 1-Tenkan/Kijun, 2-Chinkou/Cloud, 3-Chinkou/Price, 4-all together
I tested some of those alerts and it works.
4. WarningMode = 1; // Warning Mode: 0-off,1-on
This is alerts on open bar as a warning about 'crossing will be soon'.
============
============
There are 2 kinds of settings:
Besides, there are many signals of Ichimoku indicator to open the trades. I know about 6 signals (but it is much more signals in combination with each other):
The combination of all those 6 signals = Ichimoku indicator.
============
Hi Sergy. I cant get the mq5 file in this thread to compile. Keeps giving me an error. Any idea what the problem is. Thanks
IchimokuAlert_v1 indicator.
This is for Metatrader 5.
And it compiled with not a problem for me.
Example:
I have 3 versions of this indicator (one is old one, and the other two are improved versions).
All of them are compiled with no problem at all (I am using MT5 build 3021 because this beta build does not have many bugs sorry).
3 versions of this indicator are attached to the post.
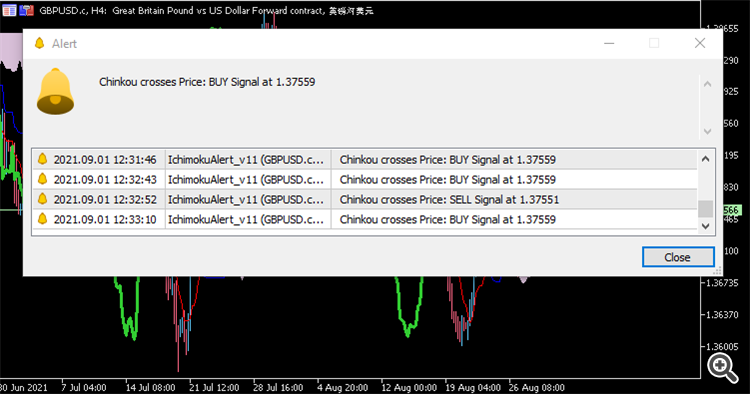
This is the settings from the latest version (too many alerts but we can disable some of them incl WarningMode may be switched to off for example to alert on close bar):Learn how to design a trading system by Ichimoku