How to predict the ranging or trend?
- All Whipsaw indicators
- Indicator that show if market is trending/ranging?
- Something Interesting in Financial Video July 2013
Forum on trading, automated trading systems and testing trading strategies
Sergey Golubev, 2013.07.01 21:04
How can we know: correction, or bullish etc (in case of using indicator for example)?
well ... let's take AbsoluteStrength indicator from MT5 CodeBase.
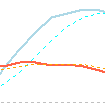
bullish (Bull market) :
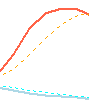
bearish (Bear market) :
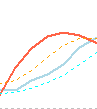
ranging (choppy market - means: buy and sell on the same time) :
flat (sideways market - means: no buy and no sell) :
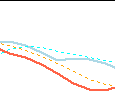
correction :
correction in a bear market (Bear Market Rally) :
Forum on trading, automated trading systems and testing trading strategies
How to Start with Metatrader 5
Sergey Golubev, 2016.08.12 17:07
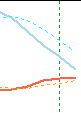
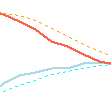
Indicator from the post above? Blue lines (signal line and the dotted line) are the bullish. The combination of those lines are providing the information about the primary trend (bullish only), and the secondary trend. Red lines (2 lines) are for bearish.
- If blue signal line is below blue dotted line = no bullish.
- If blue signal line is below blue dotted line, and red signal line is below red dotted line = flat (no bullish and no bearish).
- If 2 blue lines are above 2 red lines, and blue signal line is above blue dotted line = bullish. Opposite for bearish.
- If blue signal line is above blue dotted line, and red signal line is above red dotted line = ranging (bullish trend and bearish trend on the same time).
- If red lines are below the blue lines and we see the bearish trend on red lines = correction (secondary correction within the primary bullish trend). Opposite for the secondary rally within the primary bearish trend.
Forum on trading, automated trading systems and testing trading strategies
Sergey Golubev, 2013.07.01 21:43
red lines are for sell (sell lines), blue lines are for buy (buy lines). So, bullish (uptrend) and bearish (downtrend) are separated by color of the lines in this indicator. Buy is main blue line is above blue signal line and both are in uptrend. If "sell within no buy" - this is correction (opposite for rally). if "no buy" and "no sell" - this is flat.Thanks Golubev, is the indicator available for MT4? I read it but it is an MT5 indicator.
Thanks Golubev, is the indicator available for MT4? I read it but it is an MT5 indicator.
I did not find this indicator for MT4 in Codebase. There is almost same indicator (for MT4) in attachment (zip file) on this post, but I am not sure that it will work for MT4 build 600+ for example.
Thanks Golubev, is the indicator available for MT4? I read it but it is an MT5 indicator.
Golubev is family name.
My name is Sergey
:)
Forum on trading, automated trading systems and testing trading strategies
Sergey Golubev, 2007.08.09 14:54
Yes, it may work with your settings (daily directional TF 30). But I think you should be more busy with the market condition than I am 
Just to avoid autoclosing for example. I am trading M15 on monthly direction so I need to estimate market condition once per month for MN, Week and D1 timeframe. You probable need to do it every day for Week, D1 and H4 timeframe.
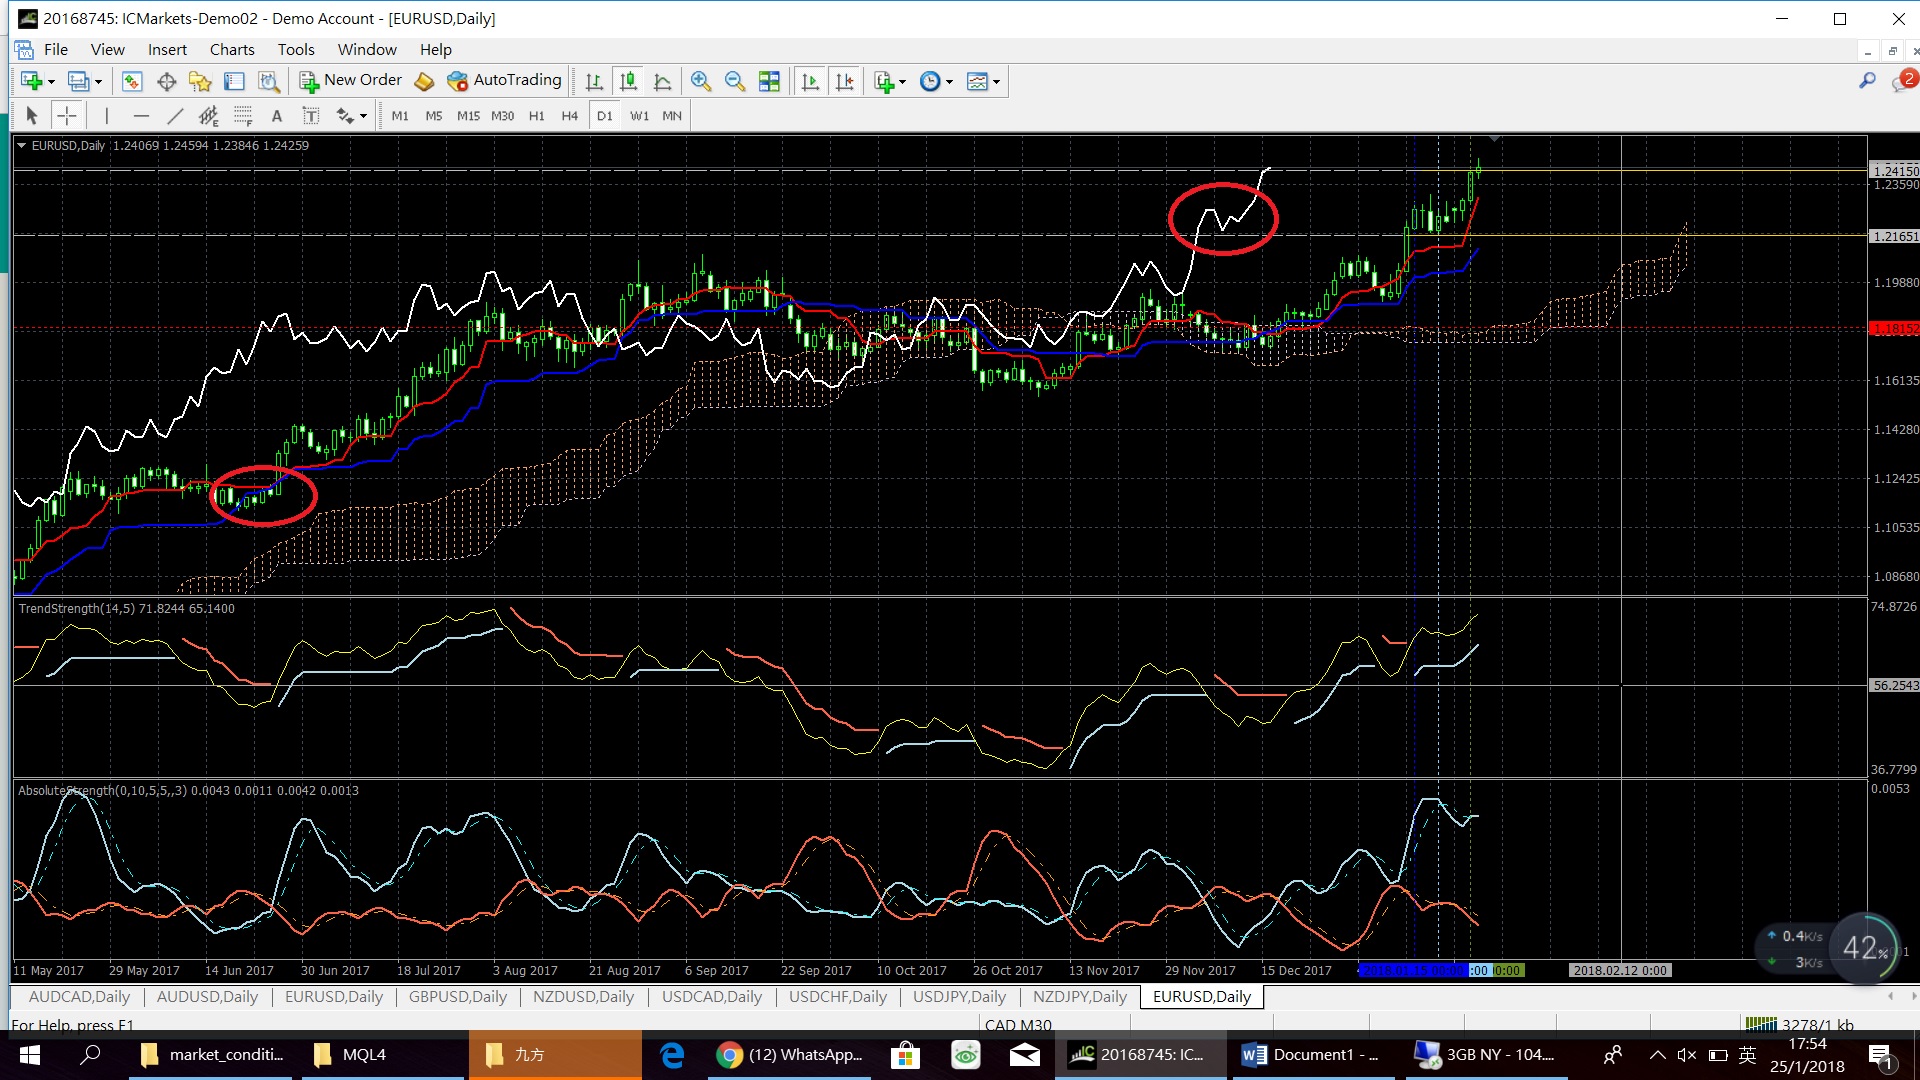
Please find template I am using for the market condition evaluation. TrendStrength indcator is understandable (blue line is uptrend). EA is using this indicator only. The other indicators: BrainTrading is understandable (arrow and dot on the same close bar is very strong signal), about Ichimoku indicator you may read some few posts on old thread (check sticky links thread for the link to the thread), and rules for AbsoluteStrength indicator is on sticky links thread as well (as a link to MTF AbsoluteStrength indicator thread).
I just open EURUSD H4 chart with this template: it is downtrend but the price came to the Ichimoku cloud so it indicates choppy market. Border of the cloud is resistance line and yellow line of Maksigen indicator is resistance line as well.
On D1 timeframe (EURUSD) we still having uptrend but our main indicator (TrendStrength) is showing downtrend (you will have sell orders only). But Ichimoku indicator: uptrend. BrainTrading is having strong sell signal but not for close bar (need to wait untill tomorrow just to validate this signal because it should be on close bar). AbsoluteStrength indicator is showing choppy market (downtrend and uptrend on the same time.
Very risky to trade.
AbsoluteStrength indicator: if uptrend and downtrend in the same time so it is shoppy market condition. If "not downtrend" and "not uptrend" in the same time so it is not-trading zone (we are not trading for this timeframe). If some trend was finished (we may see it in the upper lines: dotted line is above simple line with same color) but the other two lines below are indicating the trend started so it is correctional trend or counter trend.
Sorry for this terminolody ("uptrendand" and "downtrend") but it is the only way I may explain it.
Hahaz thx so much Sergey:DD
Some of the traders may choose ADX to determine whether the current market situation is ranging or trending, but ADX seems ineffective in predicting the ranging? Is there any indicator which can be used for predicting the ranging? Therefore, we can make the preparation for it. Thx
This my way to recognise a trend
Forum on trading, automated trading systems and testing trading strategies
When you post code please use the VIDEO button
Thank you.

- 2010.02.25
- MetaQuotes Software Corp.
- www.mql5.com
This my way to recognise a trend
thx Azid
Hi Sergey,
I am really glad to try these indicators you have shared but I have some problems regarding the indicator. I have uploaded the indicator cap screen in the attachment folder.
My question:
1) what do the blue line, red line and white line on main chart mean?
2) How can i determine the correctional downtrend. I am still quite confused about that.
thx

- Free trading apps
- Over 8,000 signals for copying
- Economic news for exploring financial markets
You agree to website policy and terms of use