indicator request
Ichimoku Kinko Hyo
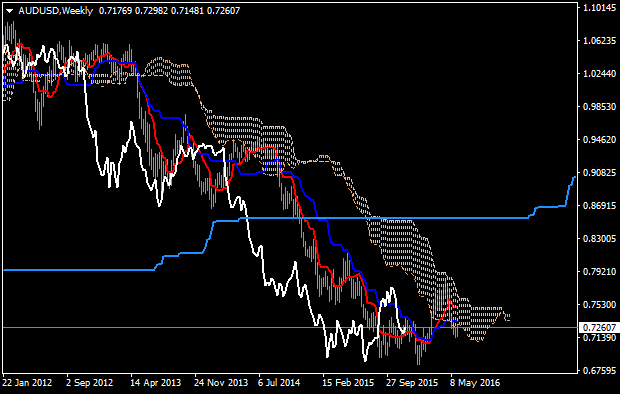
I think - it is one of the line of Ichimoku indicator but with different setting. I think (but not sure about) that it is border of the Ichimoku cloud (Senkou Span B for example). I mean - 2 Ichimoku indicators were attached to the chart: one is with default settings and the other one with the other settings (with 72/144/288 for example).
I attached template with indicator for your information (MT4) just as an example about this idea:
About the lines:
=============
Ichimoku indicator description
- Tenkan Sen - moving average of the highest high and lowest low over the last 9 trading days. (Highest high + Lowest low) / 2 over the last 9 trading days
- Kijun Sen - moving average of the highest high and lowest low over the last 26 trading days. (Highest high + Lowest low) / 2 over the last 26 trading days.
- Senkou Span A - the average of the Tenkan Sen and Kijun Sen, plotted 26 days ahead. (Tenkan Sen + Kijun Sen) / 2 plotted 26 days ahead
- Senkou Span B
- the average of the highest high and lowest low over the last 52 days,
plotted 26 days ahead. (Highest high + Lowest low) / 2 over the last 52
trading days plotted 26 days ahead.
- Chikou Span - the closing price plotted 26 days behind.
=============
Besides, there are many signals of Ichimoku indicator to open the trades. I know about 6 signals (but it is much more signals in combination with each other):
- Tenkan Sen / Kijun Sen Cross - very weak signal but it is coming as the first one ... but it may be a lot of false signals
- price crossing Kijun Sen - more strong signal
- price crossing Senkou Span A line (Kumo Breakout)
- price crossing Senkou Span B line (Kumo Breakout)
- Senkou Span A crossing the Senkou Span B (trend reversal)
- Chikou Span crossing historical price - it is most strong signal for Ichimoku but it is lagging on timeframes started with H1, and not lagging for lower timeframes
Files:
ichicustom.zip
40 kb
You are missing trading opportunities:
- Free trading apps
- Over 8,000 signals for copying
- Economic news for exploring financial markets
Registration
Log in
You agree to website policy and terms of use
If you do not have an account, please register
hi everybody.
i need this indicator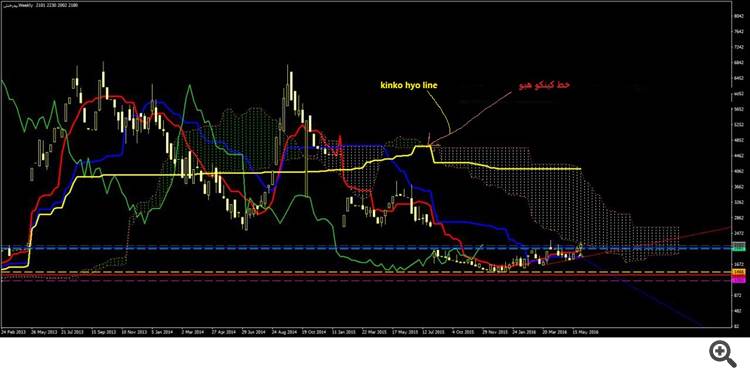
it is ichimuko with a line named kinko hyo (the yellow line).
could you help me please?