Please fix this indicator or EA - page 97
You are missing trading opportunities:
- Free trading apps
- Over 8,000 signals for copying
- Economic news for exploring financial markets
Registration
Log in
You agree to website policy and terms of use
If you do not have an account, please register
romotly007Try out this one
Hello mladen, When I loaded the indicator on several pairs I noticed it was only on EURJPY that the horizontal line appeared. Can you make it to appear on all pairs and to also appear on the current price so that I can adjust it to the price level I want for the MA to cross and sound the alert? Thank you.
Hello mladen, When I loaded the indicator on several pairs I noticed it was only on EURJPY that the horizontal line appeared. Can you make it to appear on all pairs and to also appear on the current price so that I can adjust it to the price level I want for the MA to cross and sound the alert? Thank you.
romotly007
The horizontal line was there. Only the value (price) of the horizontal line was set to the value that threw the line out of the screen (try it out - draw manually a horizontal line on chart on any sumbol and change symbol - the odds that you are not going to see the line are big even though the line is still there). The only solution is that you move the line manually when you change symbols (otherwise the line would be deleted and drawn automatically on a bid price whenever you change time frame and/or symbol)
Need a coder asap
Merry Christmas and Happy New Years to all of you. I need someone fix for me my repaint indicator. I want indicator show past repaint candle and record new repaint while trading, like DT_ZZ indicator. I will very appriciate
stocycle.mq4
stocycle.mq4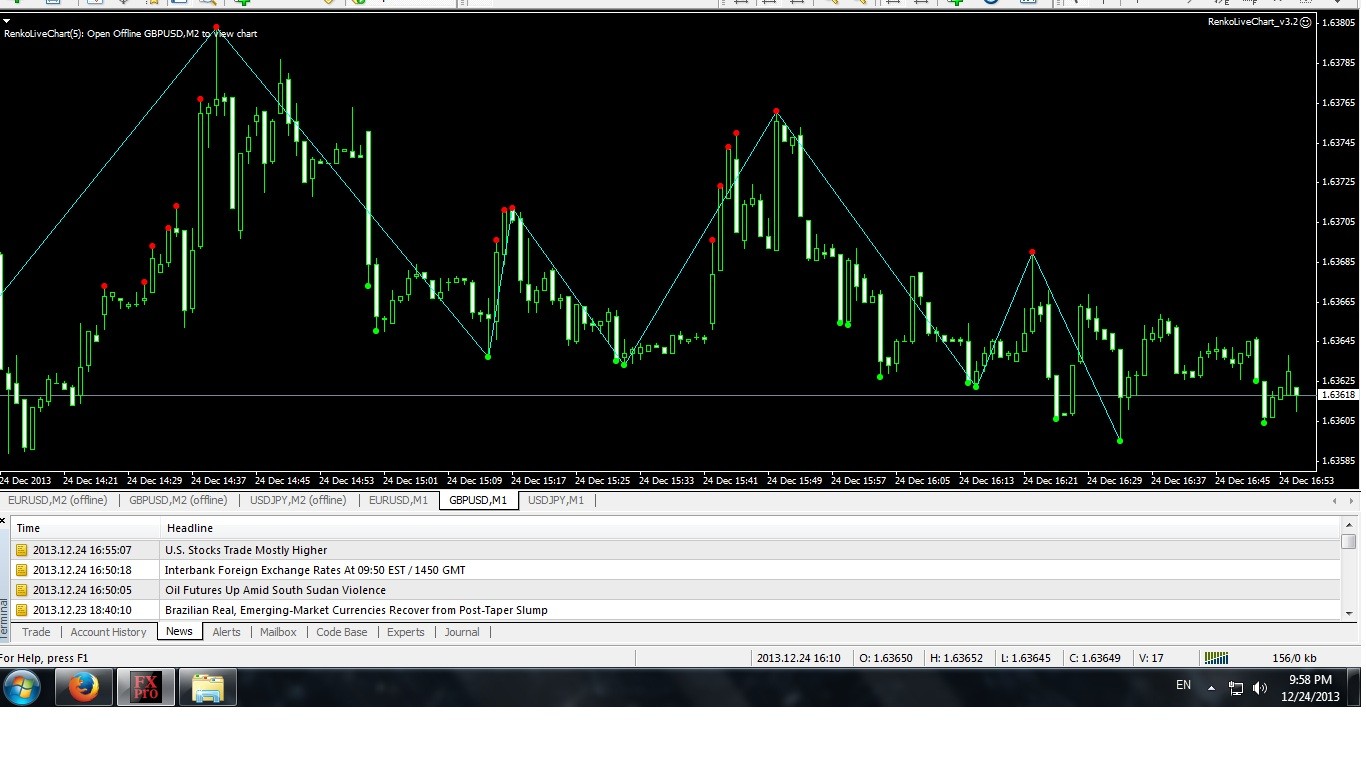
Above is DT_ZZ indicator. I want Stocycle record the repaint like this
Merry Christmas and Happy New Years to all of you. I need someone fix for me my repaint indicator. I want indicator show past repaint candle and record new repaint while trading, like DT_ZZ indicator. I will very appriciate
stocycle.mq4
stocycle.mq4
Above is DT_ZZ indicator. I want Stocycle record the repaint like thiskjmchc1010
Stochastic does not repaint (and that indicator is a 5,3,3 stochastic) so you can not do the same thing as with zigzag. To see more of the history, simply set the PeriodLength to longer and you will get something like this
romotly007The horizontal line was there. Only the value (price) of the horizontal line was set to the value that threw the line out of the screen (try it out - draw manually a horizontal line on chart on any sumbol and change symbol - the odds that you are not going to see the line are big even though the line is still there). The only solution is that you move the line manually when you change symbols (otherwise the line would be deleted and drawn automatically on a bid price whenever you change time frame and/or symbol)
Okay I will do as you say....thanks for the support.
Mtf sup/res
hi mrTools and mladen,
i have a small request concerning an indicator which i would like it to be a bit modified in its display.
its an mtf sup/res.
Right now it only displays the levels with dots. I need to be able to modify between the different styles(Lines, Dashs...).
support_and_resistance__mtfalerts.mq4
Thank you in advance for the help
regards tito,
hi mrTools and mladen,
i have a small request concerning an indicator which i would like it to be a bit modified in its display.
its an mtf sup/res.
Right now it only displays the levels with dots. I need to be able to modify between the different styles(Lines, Dashs...).
support_and_resistance__mtfalerts.mq4
Thank you in advance for the help
regards tito,Hi Tito ,
I changed it to line display and get a sort of channel is this what your looking for?
Hi Tito , I changed it to line display and get a sort of channel is this what your looking for?
Hi mrtools, no not really what i want.
may be i did not express my my idea properly...
All i want is to replace the dots with DASH (be able to choose between the different dash styles if possible. If not i'll stick to the simple dash).
this is all design and the option to have a clear vue to my chart (specially when i zoom in, the dots being bigger that the candles...) for what i know instance The dashs do not change whether you zoom in or out...
Hoping you see what i mean and be able to do it without altering the result of support and resistance levels
and thanks for the fast reply
whether these indicators repaint ma_cross_oc_alert.ex4 ? Fixed it please, thank you so much
whether these indicators repaint ma_cross_oc_alert.ex4 ? Fixed it please, thank you so much
Hotchilox, can't fix an ex4 file we need the mq4.