Multi Timeframe Indicators - page 340
You are missing trading opportunities:
- Free trading apps
- Over 8,000 signals for copying
- Economic news for exploring financial markets
Registration
Log in
You agree to website policy and terms of use
If you do not have an account, please register
:):):)
I really would like to know who was trying to make it (the mtf version) because sure as hell it was not me. It is not the only problem it had, but this time I am not going to talk about those (the list is too long). Here is a correct version (multiplier set to 2.5 and 1 hour time frame on the picture).regardsMladen
Dear mladen,
hello, would you please repair the attached indicator?
I saw your name on the first line of it.
it does'nt work perfect in mtf mode when the " multiplier " choice take e.g 2.5 , but in 3 it works well.
thank you:):):) Here is a correct version (multiplier set to 2.5 and 1 hour time frame on the picture).regards Mladen
Can you also make this in a histo form?
Thank you very much!!
Dear mladen
great job
thank you very much,
:):):) I really would like to know who was trying to make it (the mtf version) because sure as hell it was not me. It is not the only problem it had, but this time I am not going to talk about those (the list is too long). Here is a correct version (multiplier set to 2.5 and 1 hour time frame on the picture).regards Mladen
i chnge the input 15/0/2.1
i chnge the input 15/0/2.1
would you please explain more? which couple and which time frame?
would you please explain more? which couple and which time frame?
eur/usd, gbp/usd , tf 15m ,30 m, 1-h
Hi All!
I use ZUP_v86 indicator, and trying to make it able to write the results in more timeframes. I changed all Period() to my own MPeriod=5 in the code, but it still does the same (if I change time frame on a chart, the results are changing too). Why is that? Could anybody offer me a solution for that? Is there any EA, which can change timeframe on the visible chart?
Thanks,
MM
Thanx Robert
HI mf...
Most all indicators place the values in the top left corner of the indicator window box.
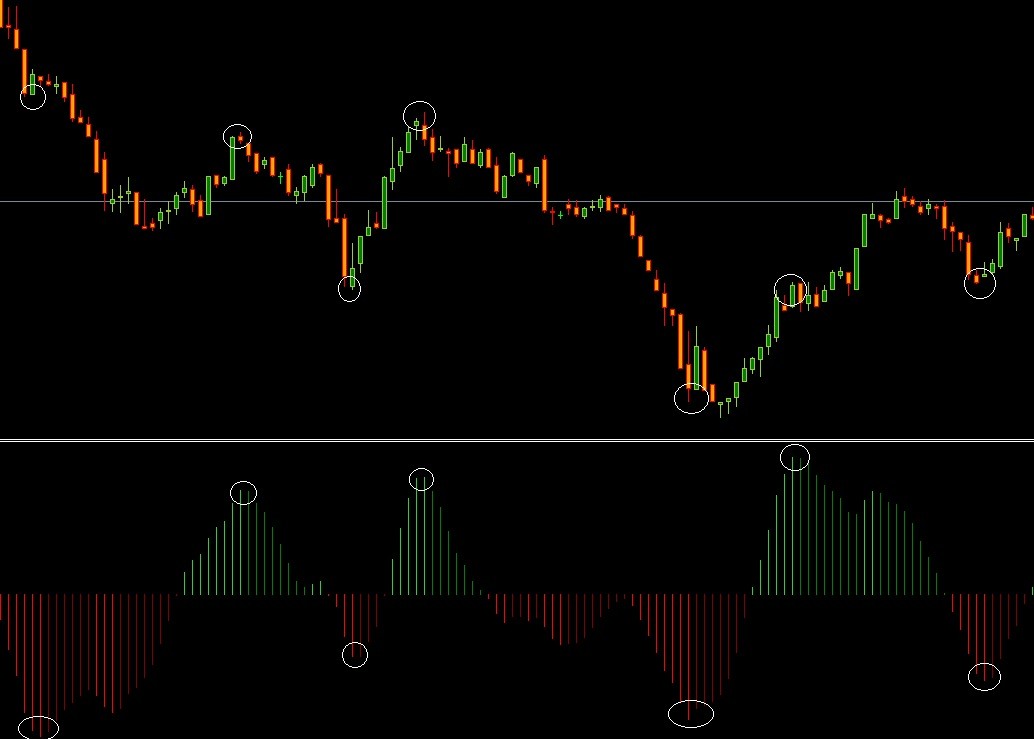
The OSMA and MACD indicators will show both positive and negative values that relate to the "height" of the bars...and you can use these buffers in your code. MACD of course adds the Signal line as well.
The screen shot attached shows both indicators with positive values for now, but you can see them go below the zero (0) line for negative values.
Hope this helps,
RobertThank you very much Robert
I actually did not see that!
Is there any whay I can use those values while coding?
I want to pick the highs and lows of the osma for every time it goes higher than 0 and lower than 0. Please see att. and ignor the price swings that i marked.
I have started to code something but do not really know what im doing I can share the mq4 if you think you know how to help.
Thank you again.
Marius