Something Interesting to Read January 2017
10 Important Books To Make You A Better Investor In 2017 (adapted from the article)
Short Reads For Beginners
The Elements of Investing: Easy Lessons for Every Investor
by Burton Malkiel and Charles Ellis
"These authors each penned one of “The Classics” below, but they join forces to provide one of my favorite short reads on investing and saving. Perfect for readers of all ages and experience levels."
The Little Book of Common Sense Investing
by John Bogle
"Jack Bogle, the father of the index fund, helped revolutionize investing. Bogle has written many books, but this relatively short one contains a lifetime of wisdom."
----------------
The Classics
A Random Walk Down Wall Street
by Burton Malkiel
"A must own for serious investors, Burton Malkiel explains the difficulty of predicting stock prices, but also focuses on aspects of investing at different stages of life."
Winning the Loser’s Game: Timeless Strategies for Successful Investing
by Charles Ellis
"This book is a classic and should be required reading for investors of all levels. With markets seemingly getting more unpredictable by the day, this book helps you avoid common traps and raise your probability for success."
Thinking, Fast and Slow
by Daniel Kahneman
"Daniel Kahneman won the 2002 Nobel Prize in Economic Sciences for his work in behavioral finance. There are countless lessons applicable to investing, but this will also transform the way you think about choices we make in business and our personal lives."
The Success Equation: Untangling Skill And Luck in Business, Sports, and Investing
by Michael Mauboussin
"This book is a slam dunk for a sports fan, but extremely useful to all investors. We quickly attribute our successes to skill, but luck plays a far greater role than most people realize. Mauboussin provides framework for identifying skill versus luck and makes concrete suggestions for using this knowledge to your advantage."
Against the Gods: The Remarkable Story of Risk
by Peter Bernstein
"Peter Bernstein explores the history of money through the lens of financial risk, beginning in ancient times and into the modern world of portfolio theory. Bernstein does an excellent job explaining the underlying mathematics in simple terms, making this book very informative and relevant to practitioners."
Fooled By Randomness
by Nassim Taleb
"Serious investors will find this Nassim Taleb's stories to be highly insightful. Using a combination of his own experiences as well as stories of others successes and failures, Taleb to help us better understand the role of chance in the world around us."
----------------
Investment Books That Will Make You Laugh
The Devil’s Financial Dictionary
by Jason Zweig
"Funny and easy read. Jason Zweig, known by most for his columns in The Wall Street Journal, is one of the best writers around. This book is relevant for anyone that has been exposed to the investment industry as an employee or customer."
Where Are the Customers’ Yachts?
By Fred Schwed
"The title is based on the story of a man admiring the yachts of New York bankers and brokers, but then wonders: where are the customers’ yachts? This book was written in the 1940’s, but still portrays many truths about the business of Wall Street."
Trade the News in Forex: How to Capitalize on the Biggest Moves in the Market
by
Michael Duane Archer

How to profit from news that moves the Forex market
Trade the News in Forex shows readers everything they need to know to
profitably trade specific Forex news events. It begins with a discussion
of what constitutes Forex news, then highlights several common news
trading techniques and outlines how broker dealers have worked to
counter these measures. The author covers several more sophisticated
techniques and systems, directs readers to a multitude of resources
available, and outlines how to combine these techniques into a current
trading strategy. There is money to be made trading Forex news, and this
book will show readers exactly how.
Michael Archer (Golden,CO) has been an active Forex and commodity
futures and Forex trader for over 30 years. He is the author of Getting
Started in Forex Trading Strategies and coauthor of the first Getting
Started in Currency Trading, Second Edition, The Forex Chartist
Companion, and Charting the Major Forex Pairs, all from Wiley. He hosts
the Forex Web site.
Forum on trading, automated trading systems and testing trading strategies
Something Interesting to Read February 2014
Sergey Golubev, 2014.02.25 16:46
Cloud Charts : Trading Successful with the Ichimoku Technique by David Linton
David Linton, the author of Cloud Charts, had his interest in Ichimoku
charts `sparked' during a presentation by Rick Bensignor at the 2004
IFTA conference in Madrid. David had heard of the method prior to the
conference but credits Rick with presenting it in an `understable' way.
David set out on a quest for Ichimoku knowledge. He researched the
internet, questioned Japanese delegates at subsequent IFTA conferences,
sought out Rick Bensignor at conferences and meetings and even flew to
Tokyo. The fruit of that quest is the book, Cloud Charts.
The Ichimoku method is now fast becoming popular in Western trading
rooms and is available on almost all technical analysis software. David
must take some credit for turning what seemed to be an exotic and
complicated method into an easily understandable and robust trading and
analysis tool for non-Japanese speaking technical analysts.
So, what is Ichimoku? The full name of the method is Ichimoku Kinko Hyo
which means 'at one glance balance bar chart'. Ichimoku charts were
devised by Goichi Hosoda , a Tokyo journalist, who believed that once
the method was fully understood, one could comprehend the exact state of
a market at a glance. Most of the Ichimoku indicators represent
equilibrium in one time frame or another and price action is generally
analysed with regard to whether the market is in equilibrium, moving
away from it or reverting back to it. By their nature, the various
indicators also offer dynamic areas of support or resistance.
Cloud Charts is divided into three parts. The first is for the novice
technical analyst and is designed to give them an understanding of many
basic technical analysis concepts involved with not only Ichimoku
analysis but also traditional techniques. More experienced technical
analysts may wish to skip this part.
Part two introduces the reader to the basic indicators used in Ichimoku
charts (David calls them cloud charts). This section deals with the
derivation and interpretation of:
1. The Turning Line (also called the Conversion Line)
2. The Standard Line ( also called the Base Line)
3. The Cloud Span A ( also called the Cloud Span 1)
4. The Cloud Span B (also called the Cloud Span 2)
5. The Lagging Line ( also called the Lagging Span)
Part two offers a guide to applying Ichimoku charts in a multiple time
frame sense, as well as the often overlooked Wave Principle, Price
Targets and Time Span Principle. However, the application of Ichimoku
charts to price and time projection is very subjective and for that
reason alone the projections are quite often not utilised by even
experienced analysts.
Looking at an Ichimoku chart, it's no surprise that analysts are
sometimes turned off by the busyness of the chart. It can look like
chaos to the uninitiated but the key to getting past that is
understanding the formula to each indicator, how they combine with each
other, how they represent a consensus of price action in different time
frames and colour-coding. In part two David explains construction and
interpretation of the charts in a manner that is easy for any newcomer
to technical analysis let alone a professional on a trading desk.
Part three, is where we are encouraged to think outside of the box.
Here, the use of Ichimoku charts are combined with other technical
analysis techniques, alternative time inputs into the indicators are
suggested and the application to market breadth analysis is considered.
There is also a chapter on back testing for the quantitative traders to
consume.
Overall, this book, in an easily read manner, brings together the body
of knowledge of a Japanese technical analysis method which was once
thought of as exotic and over-complicated. It has potential to become
the definitive English language text on the Ichimoku Kinko Hyo technical
analysis method.
by M. A. Soupios and Panos Mourdoukoutas
Here are 12 quotes from the book that provide a glimpse into the qualities and practices of great leaders:
- Skills and experience might land you a leadership position, but they don’t make you a true leader.
- Leadership comes from inside—and the greatest leaders first question themselves before they tackle the world around them. To aid in this critical interrogation.
- The "fate" of organizations is not based on the stars. The character of an organization's leadership determines a company's destiny.
- The assumption of authority brings out the leader’s inner world.
- Leadership cannot be done by the numbers.
- Toxic environments are not the result of spontaneous bad fortune. They are the resultof toxic leaders.
- Of all the many potential shortcomings an assumed leader might bring to an organization, nothing is more lethal than the arbitrary application of power.
- Supervisors who constantly micromanage, who second-guess every subordinate decision, who gleefully await any and all opportunities to criticize and bully, are a toxic presence in any environment.
- The most lethal distortions come not from the lips of our opponents or competitors. They tend to flow, instead, from our own hearts.
- Truth is an invaluable corporate asset. Don’t let it go waste. Embrace it.
- Never underestimate the power of personal integrity; always set an honorable agenda; adhere to a code of professional conduct; never try to justify dishonesty and deceit; rather fail with honor than win by cheating.
- Honest assessment is an essential requirement of effective leadership….The problem is that the higher up the ladder you go, the less likely it is that you will receive complete and accurate information.
Forum on trading, automated trading systems and testing trading strategies
Something Interesting to Read March 2014
Sergey Golubev, 2014.03.18 06:47
Technical Analysis Explained Fifth Edition : Martin Pring
The face of investing has significantly changed in the 30 years since
this book's first publication, but one essential component of the
markets has not--human behavior. Whether you're trading cornerstone
commodities or innovative investment products, observing how investors
responded to past events through technical analysis is your key to
forecasting when to buy and sell in the future. This fully updated fifth
edition shows you how to maximize your profits in today's complex
markets by tailoring your application of this powerful tool.
Tens of thousands of individual and professional investors have used the
guidance in this book to grow their wealth by understanding,
interpreting, and forecasting significant moves in both individual
stocks and entire markets. This new edition streamlines its
time-honored, profit-driven approach, while updating every chapter with
new examples, tables, charts, and comments that reflect the real-world
situations you encounter in everyday trading. Required reading among
many professionals, this authoritative resource now features:
- Brand-new chapters that analyze and explain secular trends with unique technical indicators that measure investor confidence, as well as an introduction to Pring's new Special K indicator
- Expanded coverage on the profit-making opportunities ETFs create in international markets, sectors, and commodities
- Practical advice for avoiding false, contratrend signals that may arise in short-term time spans
- Additional material on price patterns, candlestick charts, relative strength, momentum, sentiment indicators, and global stock markets
Properly reading and balancing the variety of indicators used in
technical analysis is an art, and no other book better illustrates the
repeatable steps you need to take to master it.
When used with patience and discipline, Technical Analysis Explained,
Fifth Edition, will make you a better decision maker and increase your
chances of greater profits.
Forum on trading, automated trading systems and testing trading strategies
Sergey Golubev, 2017.01.07 00:02
The New Book By The Math Professor Who Beat Las Vegas & Wall Street (based on the article)
Ed Thorp's new book is "A Man For All Markets: From Las Vegas To Wall Street, How I Beat The Dealer And The Market" (Random House, January, 2017).
- "His first book, "Beat The Dealer," published when John F. Kennedy was president, revolutionized the game of blackjack by providing a mathematically-derived method to win by playing a basic strategy and counting certain cards."
- "The legendary math professor then moved on in the late 1960s to form Convertible Hedge Associates, later to be called Princeton Newport Partners -- where he became one of the first to apply quantitative thinking to the markets, successfully, and for a long time."
- "The new book looks back at all of his amazing career. I had a chance to ask Professor Thorp a few questions about his latest work and he was kind enough to answer them."
-------------
The incredible true story of the card-counting mathematics professor who taught the world how to beat the dealer and, as the first of the great quantitative investors, ushered in a revolution on Wall Street.
Forum on trading, automated trading systems and testing trading strategies
Something Interesting to Read January 2014
Sergey Golubev, 2014.01.26 21:46
Momentum, Direction, Divergence : William Blau
In this latest volume, technical expert Bill Blau shows you how
momentum, direction, and divergence form the basis of most technical
indicators and how they can work for you to provide a considerable
competitive advantage. Clearly, concisely, and with a minimum of complex
mathematics, Blau shows you how to understand and apply them.
Integrating the latest financial insights with more than 75
easy-to-follow graphics, Blau describes the uses and limitations of many
of today's most notable technical indicators. He then demonstrates a
variety of ways in which the principles of momentum, direction, and
divergence can be used to create a versatile new set of technical
indicators or to improve the effectiveness of the most widely used
traditional indicators.
Focusing on the groundbreaking double smoothing concept, which he introduces for the first time in this book, William Blau:
- Develops reliable new momentum indicators based on double smoothing techniques
- Shows how these indicators improve the effectiveness of most popular oscillators, including the RSI, MACD, and stochastic indicators, by solving a host of timing problems
- Combines the standard Welles Wilder techniques with his original True Strength Index to improve the effectiveness of most directional movement indicators
- Introduces new ways of identifying divergence that make implementation simpler than ever
- And much more
==========
William Blau's Indicators and Trading Systems in MQL5. Part 1: IndicatorsThe first part of the article "Indicators and Trade Systems in MQL5 by William Blau. Part 1: Indicators " is a description of indicators and oscillators, described by William Blau in the book "Momentum, Direction, and Divergence".
The article describes the following groups of indicators:
- Indicators, based on the Momentum:
- Momentum (Blau_Mtm.mq5)
- The True Strength Index (Blau_TSI.mq5)
- Ergodic Oscillator (Blau_Ergodic.mq5)
- Indicators, based on Stochastic:
- Stochastic (Blau_TStoch.mq5)
- Stochastics Index (Blau_TStochI.mq5)
- Stochastic Oscillator (Blau_TS_Stochastic.mq5)
- Indicators, based on the Stochastic Momentum:
- Stochastic Momentum (Blau_SM.mq5)
- Stochastic Momentum Indicator (Blau_SMI.mq5)
- Stochastic Momentum Oscillator (Blau_SM_Stochastic.mq5)
- Indicators, based on a Mean Deviation from the market trends:
- Mean Deviation Index Indicator (Blau_MDI.mq5)
- Ergodic MDI-oscillator (Blau_Ergodic_MDI.mq5)
- Indicators based on the Moving Average Convergence/Divergence:
- MACD indicator (Blau_MACD.mq5)
- Ergodic MACD-oscillator (Blau_Ergodic_MACD.mq5)
- Indicators, based on the Candlestick Momentum:
- Candlestick Momentum (Blau_CMtm.mq5)
- The Candlestick Momentum Index (Blau_CMI.mq5)
- Candlestick Index Indicator (Blau_CSI.mq5)
- Ergodic CMI-Oscillator (Blau_Ergodic_CMI.mq5)
- Ergodic CSI-Oscillator (Blau_Ergodic_CSI.mq5)
- Indicators, based on a Composite High-Low Momentum:
- Indicator of the Virtual Close (Blau_HLM.mq5)
- Directional Trend Index Indicator (Blau_DTI.mq5)
- Ergodic DTI Oscillator (Blau_Ergodic_DTI.mq5)
Algorithmic and High-Frequency Trading (Mathematics, Finance and Risk)
by Álvaro Cartea (Author), Sebastian Jaimungal (Author), José Penalva (Author)
The design of trading algorithms requires sophisticated mathematical models backed up by reliable data. In this textbook, the authors develop models for algorithmic trading in contexts such as executing large orders, market making, targeting VWAP and other schedules, trading pairs or collection of assets, and executing in dark pools. These models are grounded on how the exchanges work, whether the algorithm is trading with better informed traders (adverse selection), and the type of information available to market participants at both ultra-high and low frequency. Algorithmic and High-Frequency Trading is the first book that combines sophisticated mathematical modelling, empirical facts and financial economics, taking the reader from basic ideas to cutting-edge research and practice. If you need to understand how modern electronic markets operate, what information provides a trading edge, and how other market participants may affect the profitability of the algorithms, then this is the book for you.
by Diane Coyle
GDP is one economic model among several that could serve the purpose, but its use conveniently leads to policies that reflect the thinking of a particular school of economic monetary and fiscal policy advocates.
We all know that in operating a business we need to be able to measure the profits of our company and then adjust our prices and production to make sure that there are enough profits to adequately fund the company. That is a relatively straightforward process, since the amount of money in the bank at the end of the month is a real number.
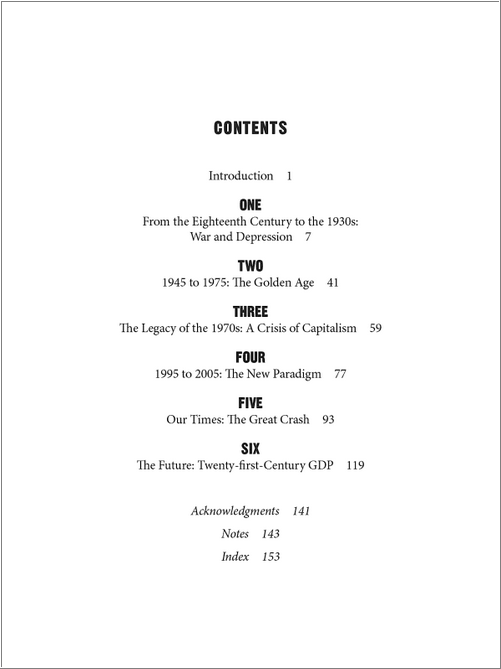
GDP: A Brief But Affectionate History is a fascinating 140-page book that I cannot recommend highly enough. This is simply the best book on GDP that I’ve ever seen. You can read it on a few hours’ plane ride or a lazy Sunday afternoon. And Ms. Coyle actually makes a relatively dry subject interesting and at times a page-turner. She has a true gift.
Ms. Coyle starts with the predecessors to Adam Smith and takes us through the 17th century right up until today with the development of GDP, so we see the ebb and flow of ideas through time. Who knew the early developers of the model did not want to include defense spending, as they saw it as a wasteful, nonproductive activity? Or that Adam Smith thought the inclusion of services in the concept was misleading. “The provision of more services was a cost to the national economy, in his view. A servant was a cost to his employer, and did not create anything. Importantly, money spent on warfare or the interest on government debt was also being used unproductively. The nation’s wealth was its stock of physical assets less the national debt. National income was what derived from the national wealth.”
Will the Real GDP Please Stand Up?
GDP is a huge undertaking, full of rules, with almost as many exceptions to the rules, changes, fixes, and qualifications, so that, as one Amazon reviewer noted, GDP is in reality so complex there are only a handful of people in the world who fully understand it, and that does not include the commentators and politicians who pontificate about it almost daily. The quarterly release of GDP statistics is more akin to a religious service than anything resembling a scientific study. The awe and breathlessness with which the number is discussed is somewhat amusing to those who understand the sausage-making process that goes into producing the number. Whether the GDP reading is positive or negative, it often changes less in a given quarter than the margin of error in the figure itself, and it can be and generally is revised significantly – often many years later when almost no one is paying attention.
GDP Is a Political Construction
GDP has always been a political construction, subject to the ebb and flow of the intellectual and political climate, the need to raise taxes, and the military needs of the day. It is also a tool used to argue for or against income inequality (depending on what country you’re in).
GDP is a financial construct at its heart, a political and philosophical abstraction. It is a necessary part of the management of the country, because, as with any enterprise, if you can’t measure it you can’t determine if what you are doing is productive. That said, the act of measuring GDP precipitates the observer effect writ large.
- Free trading apps
- Over 8,000 signals for copying
- Economic news for exploring financial markets
You agree to website policy and terms of use
This is the thread about books related for stocks, forex, financial market and economics. Please make a post about books with possible cover image, short description and official link to buy (amazon for example).
Posts without books' presentation, without official link to buy and with refferal links will be deleted.Posts with links to unofficial resellers will be deleted