
You are missing trading opportunities:
- Free trading apps
- Over 8,000 signals for copying
- Economic news for exploring financial markets
Registration
Log in
You agree to website policy and terms of use
If you do not have an account, please register
How to Avoid False Breakouts (My Secret Technique)
People use breakout strategies all the time, but are they using them correctly? In this video, I show you how to avoid false breakouts and only go in when you are confident the price will head in the direction you want it to.
You're Using The RSI WRONG...
How I Avoid False Breakouts (New Technique)
Machine Learning for Everybody – Full Course
Preparing For A Stock Market Crash With Chris Vermeulen
Forum on trading, automated trading systems and testing trading strategies
Something Interesting
Sergey Golubev, 2017.01.06 11:08
The Hidden Secret of Technical Analysis
Discover a whole 'other world' of technical analysis, where novice traders fear to go.
Suri Duddella, Webinar: The Success and Failure of Chart Patterns
Suri Duddella, 19+ years full-time Futures/Equities/Options Trader. Patterns based Algorithmic Trading. Author -- "Trade Chart Patterns Like The Pros" book.
======
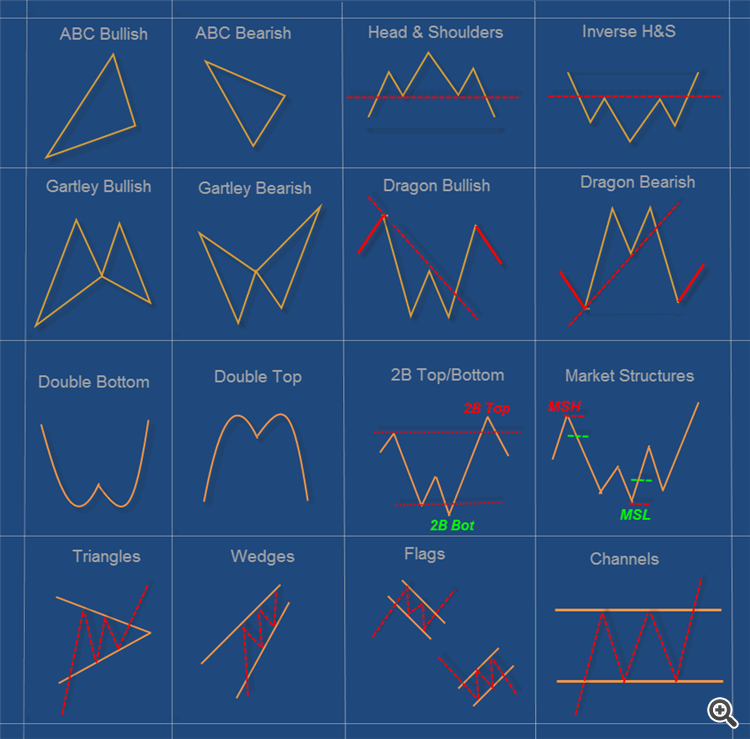
A chart pattern is a distinct formation on a stock chart that creates a trading signal, or a sign of future price movements. Chartists use these patterns to identify current trends and trend reversals and to trigger buy and sell signals.
Identifying chart patterns is simply a system for predicting stock market trends and turns! Well, a trend is merely an indicator of an imbalance in the supply and demand. These changes can usually be seen by market action through changes in price. These price changes often form meaningful chart patterns that can act as signals in trying to determine possible future trend developments. Research has proven that some patterns have high forecasting probabilities. These patterns include: The Cup & Handle, Flat Base, Ascending and Descending Triangles, Parabolic Curves, Symmetrical Triangles, Wedges, Flags and Pennants, Channels and the Head and Shoulders Patterns.