Forecast for Q3'16 - levels for GOLD (XAU/USD)
GOLD: End Of Week Technicals - correction to be started
This trading week ended with some interesting results for this pair (XAU/USD). So, let's describe some of the moments related to it.
------------------
XAU/USD
D1 price is on primary bullisgh market condition located abive Ichimoku cloud and Senkou Span line which is the virtual border between the primary bearish and the primary bullish trend on the chart. Price is crossing 1358.33 support level to below for the secondary correction to be started.
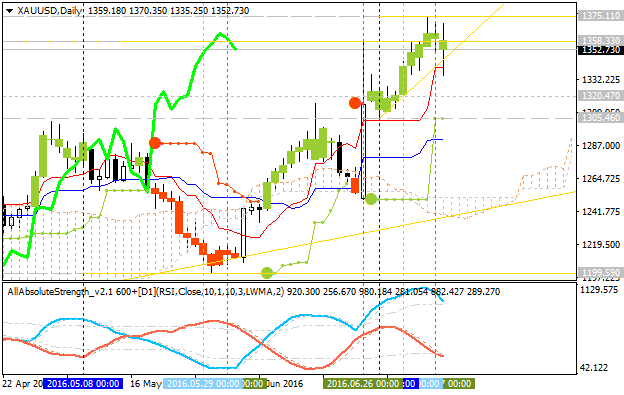
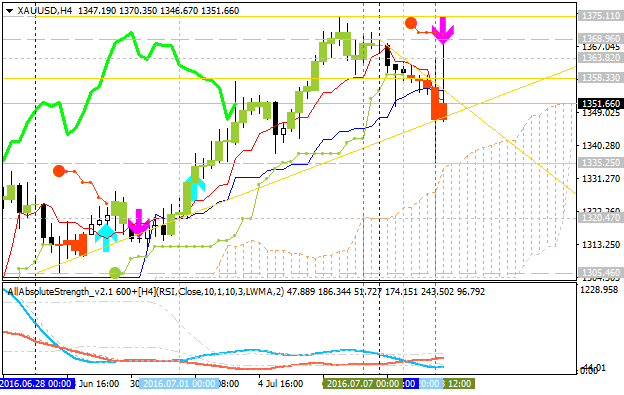
H4 price
is on secondary correction to be started within the primary bullish market condition: the price is breaking symmetric triangle pattern to below for the correction to be continuing with 1335.25 support level as a bearish reversal target. Chinkou Span line is located near and above the price to be ready to cross it to below for possible breakdown, and Absolute Strength indicator is estimating the ranging condition to be started in the near future.
If H4 price breaks 1335.25 support level on close bar so the primary bullish trend will be continuing.
If not so the price will be on the ranging within the levels.
- Recommendation to go short: watch the price to break 1335.25 support level for possible sell trade
- Recommendation to go long: watch the price to break 1375.11 resistance level for possible buy trade
- Trading Summary: ranging
| Resistance | Support |
|---|---|
| 1358.33 | 1335.25 |
| 1368.96 | 1320.47 |
| 1375.11 | 1305.46 |
SUMMARY : bullish
Forum on trading, automated trading systems and testing trading strategies
Sergey Golubev, 2016.07.16 11:34
Fundamental Weekly Forecasts for Dollar Index, GBP/USD, USD/CAD, USD/JPY, NZD/USD, AUD/USD, USD/CNH and GOLD (based on the article)
GOLD (XAU/USD) - "Note that this week constitutes an outside-weekly reversal (bearish) and highlights the risk of further declines before prices level off. Gold has continued to trade within the confines of an ascending median-line formation off the 2015 lows and a break below former resistance (now support) at 1303/08 would suggests a larger correction is underway. Such a scenario would target subsequent support objectives at 1287 & 1264/66 where the 100-day moving average converges on the key 61.8% retracement of the late May ascent. A breach above 1380 would be needed to mark resumption of the broader uptrend."
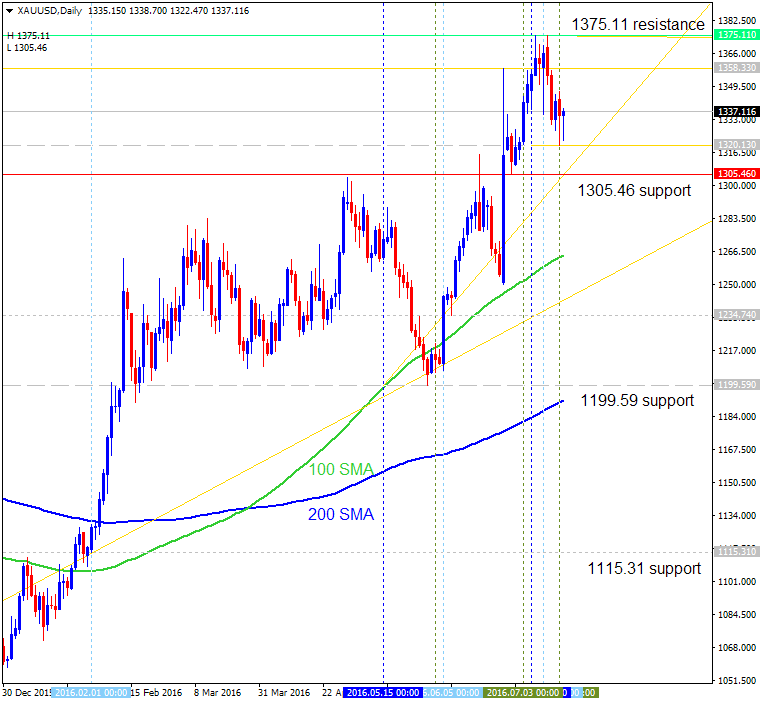
Daily price is located above 100 SMA/200 SMA reversal zone on the bullish area of the chart within the following support/resistance levels:
- 1375.11 resistance located far above 200 SMA in the bullish area of the chart, and
- 1305.46 support level located in the beginning fo the secondary correction.
If the price will break 1375.11 resistance level so the primary bullish trend will be continuing.
If the price will break 1305.46 support level so the local downtrend as the secondary correction within the primary bullish trend will be started.
If price will break 1199.59 support so we may see the reversal of the price movement to the primary bearish market condition with 1115.31 possible bearish target.
If not so the price will be ranging within the levels.
| Resistance | Support |
|---|---|
| 1375.11 | 1305.46 |
| N/A | 1199.59 |
- Recommendation to go short: watch the price to break 1305.46 support level for possible sell trade
- Recommendation to go long: watch the price to break 1375.11 resistance level for possible buy trade
- Trading Summary: ranging
SUMMARY : ranging
Forum on trading, automated trading systems and testing trading strategies
Sergey Golubev, 2016.07.23 08:45
Weekly Outlook: 2016, July 24 - July 31 (based on the article)
A busy week saw plenty of action in the yen and the pound, and a stronger dollar in general. A jey German survey, GDP data from the UK Canada and the US and rate decisions in the US and in Japan stand out. These are the major events on forex calendar.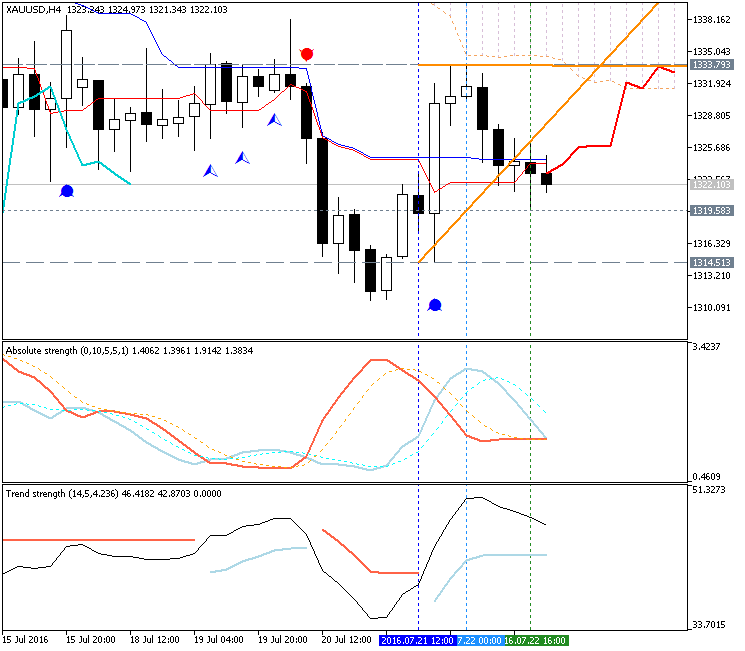
- G20 Meetings: Sat-Sun. The UK and Japan are expected to lead the discussion towards co-ordination in fiscal spending with monetary policy.
- German Ifo Business Climate: Monday, 8:00. German business moral is expected to decline moderately to 107.7 in July. The ZEW indicator already turned negative.
- US CB Consumer Confidence: Tuesday, 14:00. Us consumer confidence is expected to decline to 95.6 this time.
- UK GDP data: Wednesday, 8:30. The second quarter growth rate is expected to be 0.5%.
- US Durable Goods Orders: Wednesday, 12:30. Durable Orders are expected to drop 1.1%, while core orders are predicted to gain 0.3%in June.
- US Crude Oil Inventories: Wednesday, 14:30.
- Fed decision: Wednesday, 18:00. It seems that Yellen will wait for at least after the elections. A hint about a hike earlier than that could send the dollar higher, while a dovish Fed, which is more likely, could weigh on the greenback.
- US Unemployment Claims: Thursday, 12:30. The number of new claims is expected to reach 261,000.
- Japan Rate decision: Friday.
- Canadian GDP: Friday, 12:30. The 0.1% growth rate was in line with market forecast.
- US GDP: Friday, 12:30.
GOLD (XAU/USD) Intra-Day Technical Analysis - bearish ranging near bullish reversal levels
H4 price is located below Ichimoku cloud on the bearish area of the chart. The price is on ranging within the following key support/resistance levels:
- 1333.79 resistance level located near 'reversal' Senkou Span line in the beginning of the bullish area, and
- 1314.51 support level located far below Ichimoku cloud in the bearish area of the chart.
Chinkou Span line of Ichimoku indicator is estimating the bearish trend to be continuing, and Absolute Strength indicator is evaluating the trend as the ranging condition.
If H4 price breaks 1333.79 resistance level on close bar from below to above so the reversal of the price movement to the primary bullish market condition will be started.
If not so the price will be on ranging bearish within the levels.

- Recommendation for long: watch close H4 price to break 1333.79 for possible buy trade
- Recommendation
to go short: watch H4 price to break 1314.51 support level for possible sell trade
- Trading Summary: bearish
| Resistance | Support |
|---|---|
| 1333.79 | 1319.58 |
| N/A | 1314.51 |
Forum on trading, automated trading systems and testing trading strategies
Sergey Golubev, 2016.07.30 09:41
Weekly Outlook: 2016, July 31 - August 07 (based on the article)
US ISM Manufacturing PMI, ISM Non-Manufacturing PMI, Crude Oil Inventories, Australian and UK rate decision, Canadian and US employment data including the major US monthly employment report. These are the highlights of this week.
- US ISM Manufacturing PMI: Monday, 14:00. Manufacturing activity is expected to decline to 53.1 this time.
- Australian rate decision: Tuesday, 4:30. The RBA is expected to cut rates to 1.50% in its August meeting.
- US ADP Non-Farm Employment Change: Wednesday, 12:15. ADP report is expected to show a jobs gain of 171,000 in July.
- US ISM Non-Manufacturing PMI: Wednesday, 14:00. US services sector is expected to remain in expansion at 56 this time.
- US Crude Oil Inventories: Wednesday, 14:00. Despite the rise, crude inventories remain within the five-year range.
- UK Rate decision: Thursday, 11:00. The Bank of England is expected to cut rates to 0.25% in August.
- Mark Carney speaks: Thursday, 11:30. Mark Carney, Governor of the Bank of England will speak in London about the Inflation Report. Market volatility is expected.
- US Unemployment Claims: Thursday, 12:30. The number of new claims is expected to reach 265,000 this week.
- Canadian Employment data: Friday, 12:30. The employment market is expected to gain 10,200 jobs, while the unemployment rate is predicted to rise to 6.9% in July.
- US Non-Farm Employment Change and Unemployment rate: Friday, 12:30. The US employment market is expected to expand by 180,000 new jobs while the unemployment rate is expected to decline to 4.8%.
Forum on trading, automated trading systems and testing trading strategies
Sergey Golubev, 2016.08.06 15:44
Fundamental Weekly Forecasts for Dollar Index, GBP/USD, USD/JPY, AUD/USD, USD/CNH and GOLD (based on the article)
GOLD (XAU/USD) - "More interesting for the long-Gold thesis is the Jackson Hole Summit scheduled for August 25th-27th. This is when the foremost economic minds will meet in Wyoming to discuss global economic issues. This will include numerous Central Bankers from the U.S. and international Central Banks, finance ministers, academics and many other financial market participants. Given that many economies around the world are struggling with similar issues, with few Central Banks wanting capital flows driving the value of their currency higher, this represents an interesting opportunity for Gold bulls."
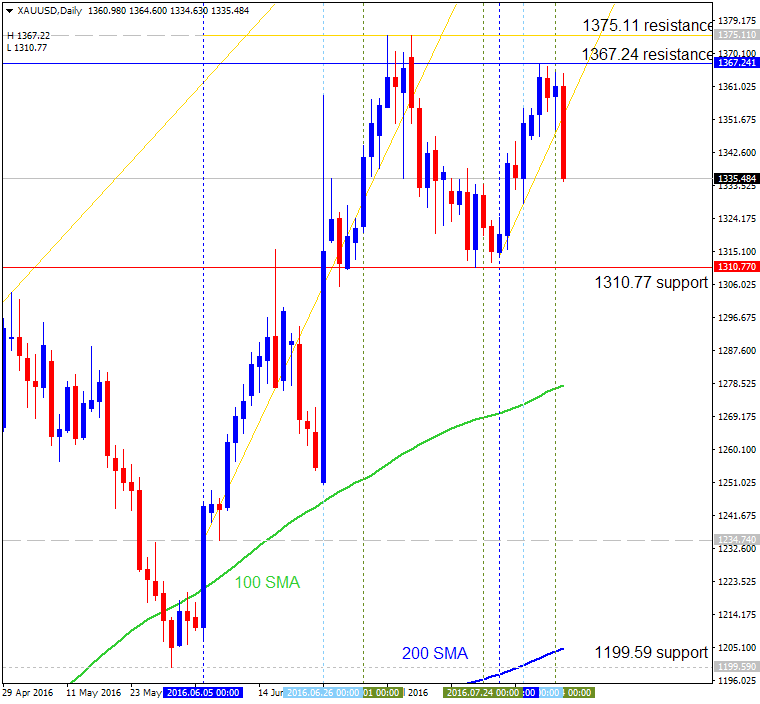
Daily price is located above 100 SMA/200 SMA ranging reversal area: the price is on bullish ranging within the following support/resistance levels:
- 1367.24 resistance level located far above 100 SMA/200 SMA on the bullish area of the chart, and
- 1310.77 located near above 100 SMA in the beginning of the secondary cotrrection to be started.
Ascending triangle pattern was formed by the price to be crossed to above for the bullish trend to be continuing.
If D1 price breaks 1367.24 resistance level on close bar from below to above so the bullish trend will be continuing with 1375.11 level as a target to re-enter.
If not so the price will be on ranging bullish within the levels.
- Recommendation for long: watch close daily price to break 1367.24 for possible buy trade
- Recommendation
to go short: watch daily price to break 1310.77 support level for possible sell trade
- Trading Summary: bullish
| Resistance | Support |
|---|---|
| 1367.24 | 1310.77 |
| 1375.11 | 1199.59 |
Forum on trading, automated trading systems and testing trading strategies
Sergey Golubev, 2016.08.13 13:20
Fundamental Weekly Forecasts for Dollar Index, USD/JPY, AUD/USD, USD/CAD, NZD/USD, USD/CNH and GOLD (based on the article)
GOLD (XAU/USD) - "We’ll be looking for a break of the objective monthly opening range with a break lower targeting 1303 & a more significant support confluence at 1287 where the 50% retracement of the late May advance converges on a pair of median-lines – Both areas of interest for possible short-side exhaustion / long-entries. While the immediate risk is for a deeper pullback, ultimately we’re looking higher in gold with a breach above near-term downtrend resistance targeting 1380."
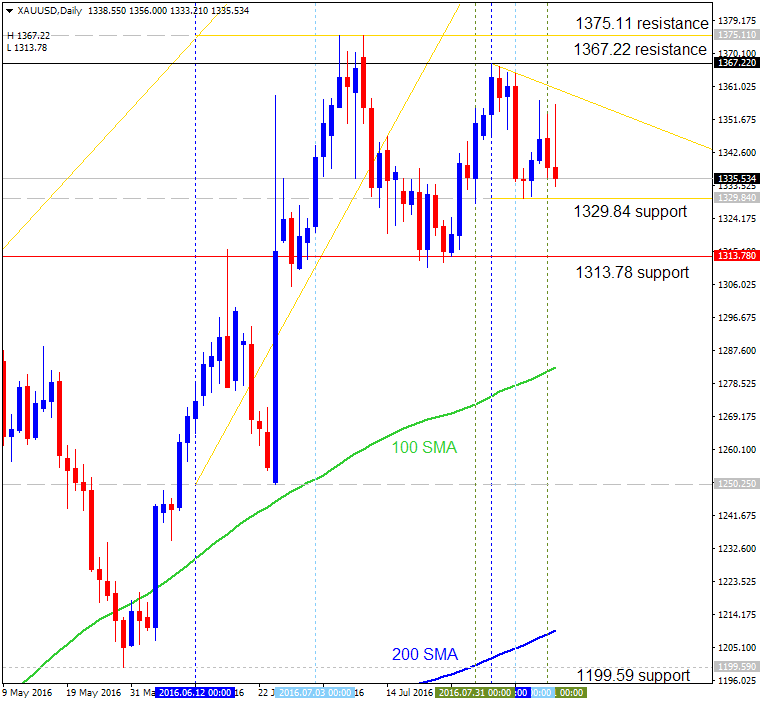
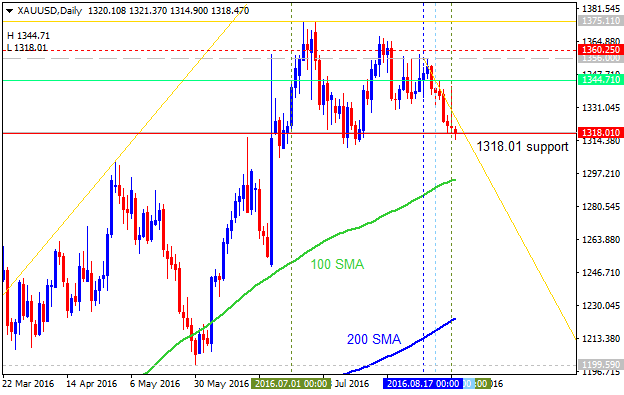
Daily price is above 100 SMA/200 SMA reversal area for the ranging within the following support/resistance levels:
- 1367.22 resistance level located above 100 SMA/200 SMA on the bullish area of the chart, and
- 1329.84 located in the beginning of the secondary correction.
Descending triangle pattern was formed by the price to be crossed to below for the correction to be started.
If D1 price breaks 1367.22 resistance level on close bar from below to above so the bullish trend will be continuing with 1375.11 target.
If not so the price will be on ranging bullish within the levels.
- Recommendation for long: watch close daily price to break 1367.22 for possible buy trade
- Recommendation
to go short: watch daily price to break 1329.84 support level for possible sell trade
- Trading Summary: ranging bullish
| Resistance | Support |
|---|---|
| 1367.22 | 1329.84 |
| 1375.11 | 1313.78 |
Forum on trading, automated trading systems and testing trading strategies
Sergey Golubev, 2016.08.16 10:04
GOLD Price Action Analysis - Intra-day ranging near 100 SMA/200 SMA reversal area for direction (based on the article)
H4 price is broke 100 SMA/200 SMA to be reversed to the primary bullish area of the chart. The price is breaking 61.8% Fibo level at 1348.03 for the bullish trend to be continuing with 1357.16 Fibo target to re-enter.
- "Gold prices have been consolidating in sideways fashion for the past month. With limited new information from the Fed regarding the status of the next rate hike, gold prices have found a comfortable range to trade in."
- "Technically speaking, this range could be taking the shape of a triangle. This pattern suggests we’ll look for lower levels to buy into. It is not uncommon for prices to briefly penetrate the triangle’s trend lines. Therefore, the risk can be set off the July 21 low near $1311."
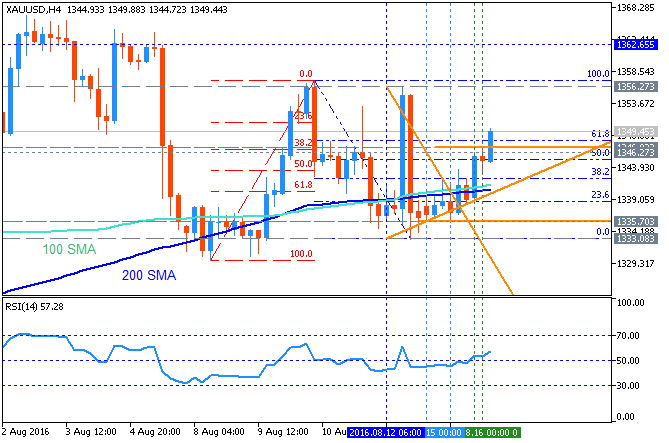
If the price breaks Fibo support level at 1333.12 so the primary bearish trend will be resumed.
If the price breaks Fibo resistance level at 1357.16 from below to above so the primary bullish trend will be continuing.
If not so the price will be on ranging within the levels.
Trend:
Forum on trading, automated trading systems and testing trading strategies
Avoid These 3 Rookie Gold Trading Mistakes Now
George Georgoudakis, 2016.08.23 03:43
Sometimes the best trade is no trade at all. The gold market continues to languish within a developing triangle pattern on the daily chart as traders await comments from Federal Reserve Chair Janet Yellen on Friday at the Fed summit in Jackson Hole Wyoming. Not a whole lotta action right now.Could Janet trigger a triangle breakout? As nearly 500 million people in advanced industrialized nations remain mired under negative interest rates policies –what if any answers do global central bankers have for the current sluggish growth prospects? Will Fed Chief Janet Yellen have any answers this week? Read more here.
In the meantime, as the gold market lumbers quietly in a tight range, it may open the door to several trading mistakes. Do any of these sound familiar?
Trading Mistake #1: Sometimes sheer boredom can trigger you into a trade.
- Looking for some excitement? Don't look to the markets for that. Don't take unplanned trades. Write your trades down ahead of time, with your entry points, objectives and stop-loss levels.
Trading Mistake #2: Trading outside your timeframe.
- Are you a short-term intraday trader?
- Are you a multi-day swing traders?
- Are you a long-term investor?
One of the elements of a successful trading and investing plan is to know your timeframe and stick to it.
Trading Mistake #3: Getting stuck and trading your "opinion."
The markets will tell you where they are going –all you have to do is watch the charts. The markets –gold or otherwise – are not going to change direction just because you doubled down on a losing trade. Good traders listen to the markets – and follow price. Markets don't care that you "know" gold has to go up right now because of XYZ.
Triangle update: Comex December gold futures remain stuck in a developing daily triangle. As a reminder, triangles are most often "continuation" patterns, which means upon a confirmed upside breakout, gold would resume its previous uptrend. See Figure 1 below.
What you need to know now:
- The triangle has not been confirmed
- The short-term picture within the triangle is weakening as gold dropped below its 20-day moving average.
- Momentum is weak-ish and lackluster.
- Watch the triangle support and resistance trendlines –it would take a sustained rally and close above the top triangle trendline to confirm an upside breakout.
Learn more about Triangles here >> Technical Analysis 101.
What's your trading plan right now?
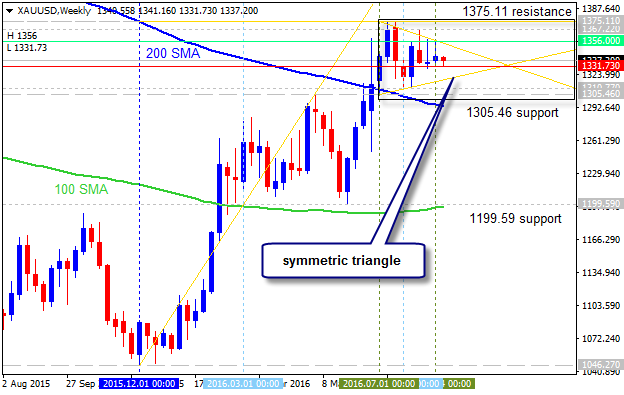
GOLD (XAU/USD), W1 timeframe: symmetric triangle pattern
Forum on trading, automated trading systems and testing trading strategies
Sergey Golubev, 2016.08.28 08:23
Fundamental Weekly Forecasts for Dollar Index, GBP/USD, USD/JPY, AUD/USD, NZD/USD, USD/CNH and GOLD (based on the article)
GOLD (XAU/USD) - "Heading into next week, greater emphasis may surround the August U.S. Non-Farm Payrolls report as market participants continue to gauge the outlook for the next Fed rate hike. Indeed on Friday Federal Reserve Vice Chairman Stanley Fischer stated that, “We’ve had very strong hiring reports in the last three months,” and incoming labor data, “will probably weigh on our decision, along with other data that may come in.” In light of the recent rhetoric emanating from the economic symposium, a strong employment report may boost expectations for a 2016 rate hike as Chair Yellen argues the, “case for an increase in the federal funds rate has strengthened in recent months.” From a technical standpoint, the risk remains for further losses near-term before mounting a more significant rally."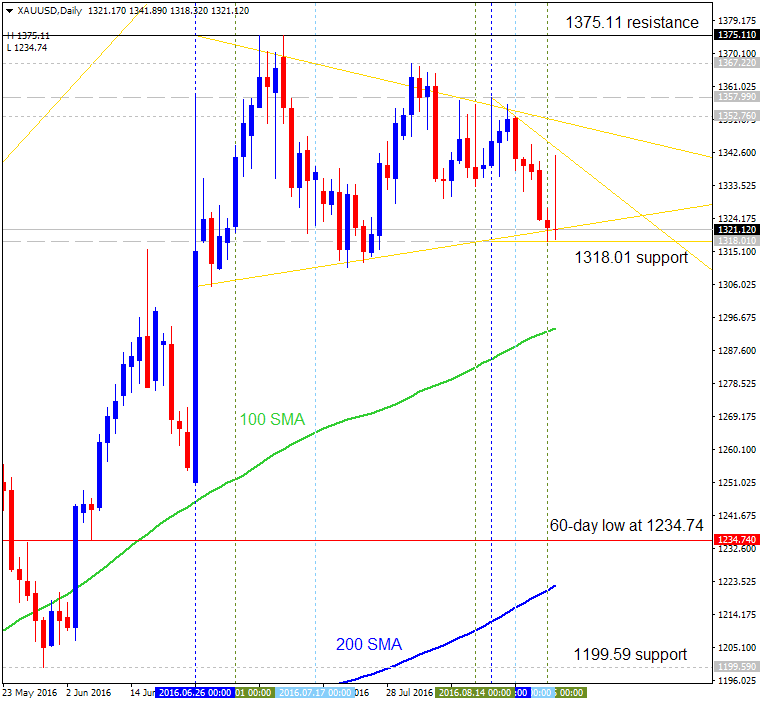
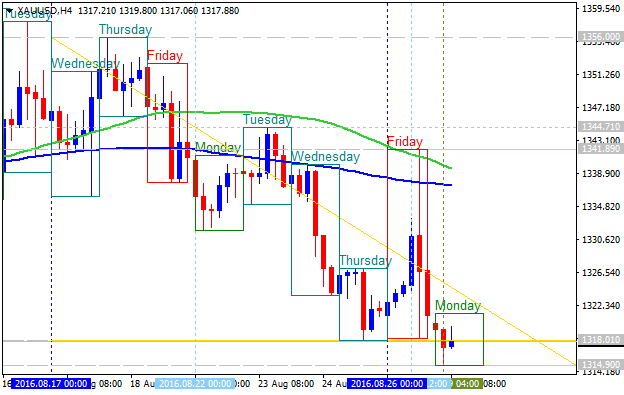
New daily bar was opened above above 1318.01 which means that the secondary correction will not be started on this Monday. So, we will wait for tomorrow for example. The most likely scenarios for the daily price are the following: the secondary correction within the primary bullish trend will be started, or bullish ranging within the levels.
As to intra-day price movement (H4 timeframe) so the price is already testing 1318.01 support level together with descending triangle pattern to below for the bearish trend to be continuing:
- Free trading apps
- Over 8,000 signals for copying
- Economic news for exploring financial markets
You agree to website policy and terms of use
Quick Technical Overview: Technical Targets for GOLD (XAU/USD) - breaking 1,360 area for the bullish trend to be continuing
H4 price is located to be above 100 SMA/200 SMA reversal on the bullish area of the chart: the price is breaking 1341.42 resistance level to above for the bullish trend to be continuing with 1360.25 level as a nearest bullish target to ere-enter.
If the price breaks 1341.42 resistance level to above on close H4 bar so 1360.25 level will be the next bullish target, if the price breaks 1320.47 support to below on close bar so the local downtrend as the secondary correction within the primary bullish trend will be started, if the price breaks 1265.00 support level so we may see the bearish reversal to be started on this timeframe, otherwise - the price will be on bullish ranging within the levels.
Daily price is on primary bullish market condition by 1358.33 resistance level to be broke to above for the bullish trend to be continuing.