Press review - page 442
You are missing trading opportunities:
- Free trading apps
- Over 8,000 signals for copying
- Economic news for exploring financial markets
Registration
Log in
You agree to website policy and terms of use
If you do not have an account, please register
Forum on trading, automated trading systems and testing trading strategies
Indicators: EES V Speed
Sergey Golubev, 2014.06.07 07:43
3 Reasons Volatility Might Increase (adapted from Forbes article)
Where art thou volatility? Not here, nor there, but soon to revive, me thinks. Volatility in risk markets is simply the measurement of variation in prices which is often calculated over certain time periods and against the idea of a normal distribution. The most important markers are historical (statistical) volatility and implied volatility. Historical volatility is a retrospective measurement of actual pricing variations whereas implied volatility is the theoretical price of an asset taking into account actual prices, historical volatility, a time component and the risk free rate within a pricing model such as the Black-Scholes model. Both historical and implied volatility have recently declined to cycle lows in many asset classes. The consensus call is for continued calm waters and a potential further decrease in volatility. The consensus call for tame volatility may be underestimating three potential drivers to higher volatility this year: rising inflation and Federal Reserve policy, a taper tantrum and geopolitical unknowns.
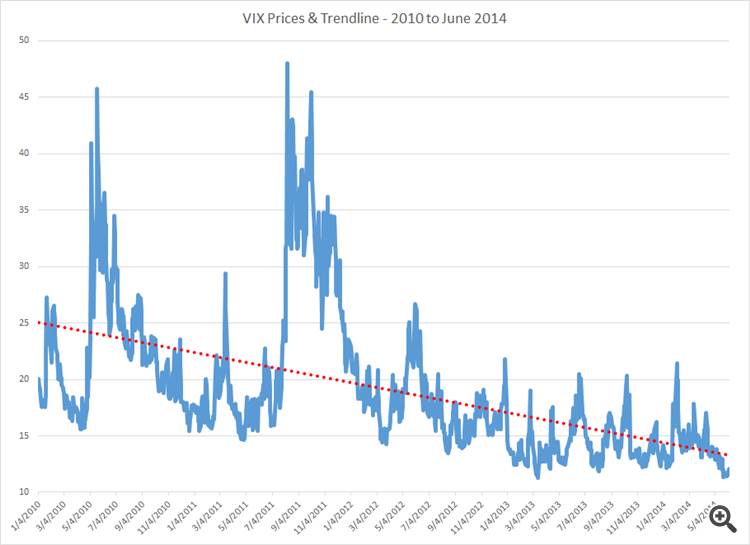
The most popular measure of market volatility in the US is the CBOE Market Volatility Index (the “VIX”) which is also known rather ominously as the “fear gauge.” The VIX measures a weighted average of the implied volatility of a wide range of S&P 500 options with a 30 day maturity. Quite simply, the VIX is the implied volatility of the S&P 500 and is frequently thought of as the market’s broad expectation of volatility over the next 30 day period. The VIX has been on a downward trajectory since 2010.
The VIX has an audience across asset classes as it can give insight into the short term biases and leanings of US equity market participants. To be clear, the VIX is one tool to measure perceived volatility and although a high VIX or an upward trend is most often the result of a declining equity market, the gauge can increase as well when call holders refuse to sell options absent a larger premium. Thus, the VIX can be a measure of upside or downside moves with higher numbers representing the anticipation of sharper moves. Somewhat ironically, there are many instances where higher VIX prices correlate strongly to higher prices in the S&P 500 as the fear dissipates and markets readjust.
The VIX and other measurements of volatility have continued to trend down for many reasons including the fact that the world’s central banks have maintained highly accommodative monetary policies. The European Central Bank has just announced a program of direct asset purchases including the cessation of the “sterilization” of their current markets program. Moreover, secondary central banks like the Bank of Mexico have cut rates in an effort to spur higher inflation. Assuming a direct correlation between liquidity and volatility, all of these programs should act as a governor to higher volatility. Other reasons offered to explain the calmness in markets include exceedingly low trading volumes, range bound markets, recently improving economic data and fewer economic surprises, the transparency of corporate reporting, and the perception that there is no immediate catalyst to drive volatility higher.
Although the trend in volatility is clearly downwards, current complacency should not be mistaken for a permanent drift to lower levels without significant bumps higher and mini-reversals within the trends. Once again, investors are putting their faith into central banks which are doing the one thing that they ostensibly know how to do and have done continuously since 2008 – providing ever increasing amounts of liquidity. To be sure, the ultimate effect of non-traditional monetary policy is unknown and the Federal Reserve and the Bank of England are poised to withdraw some of their stimulus in the medium term. Already, markets are pricing in rate hikes in the US for mid-2015 yet doing so without increased volatility. It is reasonable to suggest that the greatest risk to increased volatility and general market stability may be a mismatch between Federal Reserve policies, the expectations of the bond market and microeconomic data. This triumvirate of fast friends may find itself in an increasingly uncomfortable alliance should US inflation data significantly or unexpectedly increase. Admittedly, higher US inflation in a world currently exporting deflation to US shores is not likely to result in the sustained kind. However, the prospect of Chair Yellen attempting to explain away asymmetric inflation readings as transitory should push up volatility in the bond market.
There is also sensibility in remembering that monetary policy changes frequently take longer to translate to market prices than assumed. It is quite possible that the lingering effects of central bank liquidity will not be felt as a primary cause of higher volatility but rather a second derivative premised upon some otherwise routine market upheaval. When long positions are longer and short positions are shorter, based upon liquidity rather than fundamentals, the correlation between liquidity and volatility cited as calming the markets may cut both ways. Increased liquidity may provide for smooth markets at the outset but higher levels of risk may creep upon casually disciplined risk managers and with it the miasma of higher volatility.
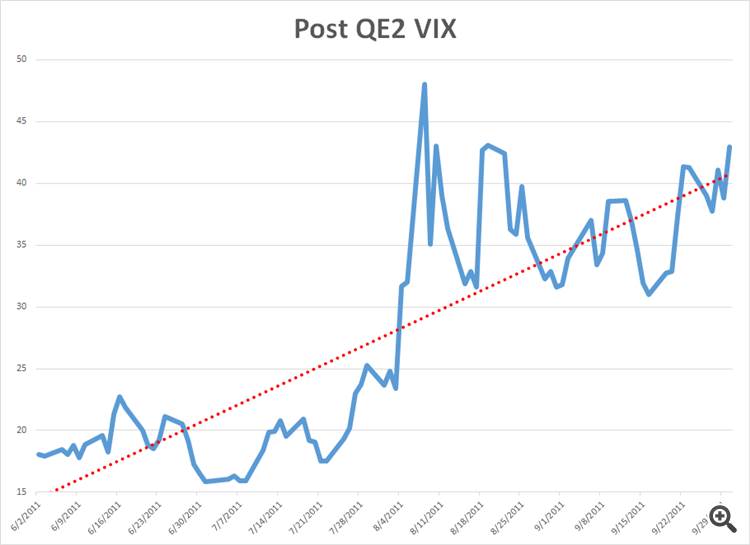
Another reason that volatility could creep higher is the possibility of a “taper tantrum” over the final end of Quantitative Easing. As an analogue one need only to look at the increase in volatility as measured by the VIX after QE2 ended in June of 2011.
The Federal Reserve’s “stock versus flow” argument will be put to the ultimate test assuming tapering continues apace and QE ends toward the end of 2014.
Volatility may also temporarily and dramatically increase due to unexpected geopolitical events. There is a mini civil war in Ukraine right now and it threatens to draw European powers into supporting a proxy contest for Eastern Ukraine between Russia and the West. While Europeans go about deciding where to holiday this summer, the conflict in Ukraine is likely to remain in a sort of pressure cooked stasis. Once the weather turns cold and natural gas for heating is no longer an abstraction the conflict in Ukraine will either resolve quickly or find another gear. Beyond Ukraine, nuclear negotiations with Iran continue to simmer, China and Japan yap at each other and Assad kills off his critics in Syria. Any of these issue may cause a spike in volatility and to expect all of these issues to transpire exactly as a game planned seems rather naïve.
It is true that volatility has decreased. The CBOE Commitments of Traders Report for VIX futures shows a significant net long position for financial players confirming the bias to groupthink towards increasingly lower volatility. This tendency towards anticipating ever decreasing or steadily low volatility flies in the face of the fact that the VIX currently trades at a 45% discount to its longer term historical price average of $20. The odds of a temporary spike in volatility are very good over the remainder of the year and a reversal to slightly higher trend volatility is especially plausible should microeconomic conditions warrant even a slight rethink of monetary policy scenarios. To profit from volatility, is usually to buy it when it is not needed, rather than when the consensus theory is “unexpectedly” being pilloried and volatility is exploding higher.
Forum on trading, automated trading systems and testing trading strategies
Discussion of article "MQL5 for Newbies: Guide to Using Technical Indicators in Expert Advisors"
Sergey Golubev, 2014.02.27 16:46
Introduction to Technical Indicators (based on dailyfx aticle)
Trend Following
Trend following indicators were created to help traders trade currency pairs that are trending up or trending down. We have all heard the phrase “the trend is your friend.” These indicators can help point out the direction of the trend and can tell us if a trend actually exists.
Moving Averages
A Moving Average (MA for short) is a technical tool that averages a currency pair’s price over a period of time. The smoothing effect this has on the chart helps give a clearer indication on what direction the pair is moving… either up, down, or sideways. There are a variety of moving averages to choose from. Simple Moving Averages and Exponential Moving Averages are by far the most popular.
Ichimoku
Ichimoku is a complicated looking trend assistant that turns out to be much simpler than it initially appears. This Japanese indicator was created to be a standalone indicator that shows current trends, displays support/resistance levels, and indicates when a trend has likely reversed. Ichimoku roughly translates to “one glance” since it is meant to be a quick way to see how price is behaving on a chart.
ADX
The Average Direction Index takes a different method when it comes to analyzing trends. It won’t tell you whether price is trending up or down, but it will tell you if price is trending or is ranging. This makes it the perfect filter for either a range or trend strategy by making sure you are trading based on current market conditions.
Oscillators
Oscillators give traders an idea of how momentum is developing on a specific currency pair. When price treks higher, oscillators will move higher. When price drops lower, oscillators will move lower. Whenever oscillators reach an extreme level, it might be time to look for price to turn back around to the mean. However, just because an oscillator reaches “Overbought” or “Oversold” levels doesn’t mean we should try to call a top or a bottom. Oscillators can stay at extreme levels for a long time, so we need to wait for a valid sign before trading.
RSI
The Relative Strength Index is arguably the most popular oscillator out there. A big component of its formula is the ratio between the average gain and average loss over the last 14 periods. The RSI is bound between 0 – 100 and is considered overbought above 70 and oversold when below 30. Traders generally look to sell when 70 is crossed from above and look to buy when 30 is crossed from below.
Stochastics
Stochastics offer traders a different approach to calculate price oscillations by tracking how far the current price is from the lowest low of the last X number of periods. This distance is then divided by the difference between the high and low price during the same number of periods. The line created, %K, is then used to create a moving average, %D, that is placed directly on top of the %K. The result is two lines moving between 0-100 with overbought and oversold levels at 80 and 20. Traders can wait for the two lines to crosses while in overbought or oversold territories or they can look for divergence between the stochastic and the actual price before placing a trade.
CCI
The Commodity Channel Index is different than many oscillators in that there is no limit to how high or how low it can go. It uses 0 as a centerline with overbought and oversold levels starting at +100 and -100. Traders look to sell breaks below +100 and buy breaks above -100. To see some real examples of the CCI in action,
MACD
The Moving Average Convergence/Divergence tracks the difference between two EMA lines, the 12 EMA and 26 EMA. The difference between the two EMAs is then drawn on a sub-chart (called the MACD line) with a 9 EMA drawn directly on top of it (called the Signal line). Traders then look to buy when the MACD line crosses above the signal line and look to sell when the MACD line crosses below the signal line. There are also opportunities to trade divergence between the MACD and price.
Volatility
Volatility measures how large the upswings and downswings are for a particular currency pair. When a currency’s price fluctuates wildly up and down it is said to have high volatility. Whereas a currency pair that does not fluctuate as much is said to have low volatility. It’s important to note how volatile a currency pair is before opening a trade, so we can take that into consideration with picking our trade size and stop and limit levels.
Bollinger Bands®
Bollinger Bands print 3 lines directly on top of the price chart. The middle ‘band’ is a 20-period simple moving average with an upper and low ‘band’ that are drawn 2 standard deviations above and below the 20 MA. This means the more volatile the pair is, the wider the outer bands will become, giving the Bollinger Bands the ability to be used universally across currency pairs no matter how they behave. The wider the bands, the more volatile the pair. Most common uses for Bollinger Bands are trying to trade double tops/bottoms that hit an upper or lower band or looking to trade bounces off an outer band in the direction of the overall trend.
Bollinger Bands® is a registered trademark of John Bollinger.
ATR
The Average True Range tells us the average distance between the high and low price over the last X number of bars (typically 14). This indicator is presented in pips where the higher the ATR gets, the more volatile the pair, and vice versa. This makes it a perfect tool to measure volatility and also can be a huge help when selecting where we should set our stop losses.
Support/Resistance
Pivot Points
Being one of the older technical indicators, Pivot Points are one of the most widely used in all markets including equities, commodities, and Forex. They are created using a formula composed of high, low and close prices for the previous period. There is a central pivot line and subsequent support lines and resistance lines surrounding it. Traders use these lines as potential support and resistance levels, levels that price might have a difficult time breaking through.
Donchian Channels
Price channels or Donchian Channels are lines above and below recent price action that show the high and low prices over an extended period of time These lines can then act as support or resistance if price comes into contact with them again. A common use for Donchian channels is trading a break of a line in the direction of the overall trend. This strategy was made famous by Richard Dennis’ Turtle Traders where Dennis took everyday people and was able to successfully teach them how to trade futures based on price channels.
USD/CNH Intra-Day Fundamentals: China Consumer Price Index and 42 pips price movement
2016-10-14 01:30 GMT | [CNY - CPI]
if actual > forecast (or previous one) = good for currency (for CNY in our case)
[CNY - CPI] = Change in the price of goods and services purchased by consumers.
==========From RTT News article:
==========
USD/CNH M5: 42 pips range price movement by China Consumer Price Index news event
Dollar Index Overview: breaking 98.13 resistance for 98.33/58 bullish target (adapted from the article)
D1 price is located above SMA with period 100 (100 SMA) and SMA with the period 200 (200 SMA) for the bullish market condition. The price is on breaking 98.13 to above for the bullish trend to be continuing with 98.33/58 bullish target.
If the price will break 98.13 resistance level so we may see the bullish trend to be continuing.
If price will break 95.69 support so the reversal of the daily price movement from the bullish to the primary bearish trend will be started.
If not so the price will be ranging within the levels.
EUR/USD Rebounds From Weekly Lows (based on the article)
Daily price was on the breakdown with the bearish reversal: the price was bounced from one week low at 1.0985 to above for the ranging bearish condition to be started:
"The EUR/USD is beginning to pair losses after closing lower for 3 consecutive sessions and declining as much as 219 pips for the week. The current daily low for the EUR/SUD resides at 1.0985, but technical traders will continue to monitor the psychological 1.1000 level going into tomorrow’s University of Michigan’s Confidence figures and Janet Yellen’s speech at the Boston Fed conference. Both of these events are marked as high importance events, with both having the ability to shift the direction of the EUR/USD."
Intra-Day Fundamentals - EUR/USD, USD/CAD and NZD/USD: U.S. Advance Retail Sales
2016-10-14 12:30 GMT | [USD - Retail Sales]
if actual > forecast (or previous one) = good for currency (for USD in our case)
[USD - Retail Sales] = Change in the total value of sales at the retail level.
==========
From MarketWatch article: U.S. retail sales snap back in September
"Sales at U.S. retail stores rebounded in September, with auto dealers and gas stations racking up the biggest gains, in a sign consumers are still spending fast enough to keep the economy on solid ground. Retail sales rose 0.6% last month to snap back from a small decline in August that was the first in five months. Economists surveyed by MarketWatch had forecast a 0.7% increase."
==========
EUR/USD M5: 25 pips range price movement by U.S. Advance Retail Sales news events
==========
USD/CAD M5: 23 pips range price movement by U.S. Advance Retail Sales news events
==========
NZD/USD M5: 24 pips price movement by U.S. Advance Retail Sales news events
Intra-Day Fundamentals - EUR/USD and DAX Index: Fed Chair Yellen Speaks at the Federal Reserve Bank
2016-10-14 17:30 GMT | [USD - Fed Chair Yellen Speaks]
[USD - Fed Chair Yellen Speaks] = Speech named "Macroeconomic Research After the Crisis" at the Federal Reserve Bank of Boston’s Annual Research Conference.
==========
From Bloomberg article: Yellen Sees ‘Plausible Ways’ Hot Economy Could Heal Growth
==========
EUR/USD M5: 24 pips price movement by Fed Chair Yellen Speaks news events
==========
DAX Index M5 price movement by Fed Chair Yellen Speaks news events
Weekly Outlook: 2016, October 16 - October 23 (based on the article)
Draghi’s speech, inflation data in the UK and the US, Employment data in the UK, the US and Australia, Rate decision in Canada and the Eurozone as well as manufacturing data from the US. These are the top events on forex calendar.EUR/USD Weekly Outlook: 2016, October 16 - October 23 (based on the article)
EUR/USD was on the back foot as the US dollar dominated across the board. Can it continue falling?. The upcoming week’s highlight is undoubtedly the ECB meeting. Here is an outlook for the highlights of this week.Dollar Index - "As always, Dollar traders should also keep the pulse on risk trends. Full-tilt risk appetite is unlikely, but it would nevertheless reinforce rate forecasts for the Fed and thereby a Dollar advantage. A neutral bearing would have far more interpretation for currency traders. Jumping to panicked risk aversion, we would see the long-dormant return of the Greenback’s liquidity appeal. The increasingly probable and problematic (for the Dollar) scenario comes in the belly of this spectrum with modest risk aversion. While benchmarks like the S&P 500 would fall in this environment, so too would USD as it loses its interest rate advantage premium."