Join our fan page

Jay Digital Parabolic Spy Indicator - indicator for MetaTrader 4
- Views:
- 18765
- Rating:
- Published:
- Updated:
-
 You are missing trading opportunities:
- Free trading apps
- Over 8,000 signals for copying
- Economic news for exploring financial markets
Registration Log inYou agree to website policy and terms of use
If you do not have an account, please register -
 Need a robot or indicator based on this code? Order it on Freelance
Go to Freelance
Need a robot or indicator based on this code? Order it on Freelance
Go to Freelance
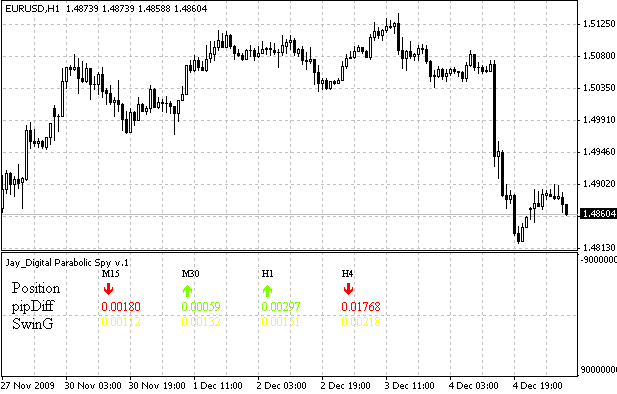
Jay Digital Parabolic Spy is a multi timeframe indicator based on the parabolic sar.
It displays timeframes from 15 minutes to 4 hours.
If the parabolic sar is below the price (indicating a buy position), then a green arrow pointing up will be displayed otherwise, a red arrow pointing down will be displayed.
The indicator shows 3 values: Position, pipDifference and SwinG.
The position indicates which direction the parabolic sar is currently in. It will display a green arrow for buy and a red arrow for sell.
Pipifference tells us howfar in pips the price is from the parabolic sar or in other words, how many pips in the oposite direction the parabolic sar will have to move before there is a reversal of the signal.
SwinG is simply the entire length of the candle measured in pips.
Please note that all the values are for the current candles on their respective timeframes.
Image:
Elliott Waves Indicator
The indicator helps to use the Elliott waves, as described in the book "Trade Chaos" by Bill Williams.
 ArrayVirtualOrders
Library for virtual trading.
 Break-even price level (without loss level)
The script shows the price level, where total profit for all of the opened positions will be non-negative (without loss level, or break-even price level).
Jays Candle Display
Jays candle display is a multi candle displaying indicator. It displays the swing and body of candles on different timeframes from one minute up to one day.