Join our fan page
- Views:
- 15983
- Rating:
- Published:
- Updated:
-
Need a robot or indicator based on this code? Order it on Freelance Go to Freelance
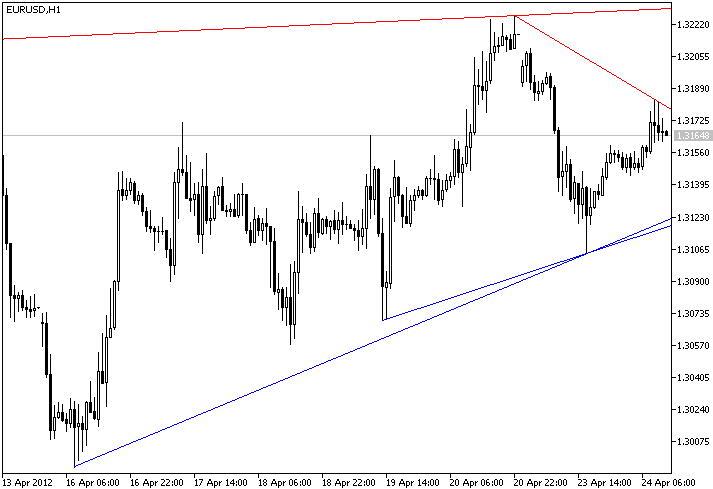
Whatever your strategy, you need to know where are supports and resistances lines, eventually you will appreciate to be alerted if they are reached.
This indicator rescan line each time you change the time scale of the chart and send you an optional alert if one is under a tunable limit.

 AutoNK
The indicator creates a channel and provides the possibility to configure it with automatic tuning.
 Smooth Lines
The indicator shows the use of the free Library for Custom Chart library for the automatic connection of the indicators to iCustomChart custom charts created on the basis of custom history files.
 Pivot Point
Classic Pivot Point indicator paints pivot point and three resistance and support levels for all data points.
 News VLine
The script adds vertical lines on the chart at the news events.