 MetaTrader 5
 Experts
 Indicators
 Scripts
 Libraries
 Storage
Watch how to download trading robots for free
Find us on Telegram!
Join our fan page
Join our fan page
You liked the script? Try it in the MetaTrader 5 terminal

Volume Profile with Naked POC - day, week, month or year profiles built from M1 bars - indicator for MetaTrader 5
Muhammad Muqeem Korejo

Hi, I'm Muhammad Muqeem Korejo, an MQL4/MQL5 developer from Pakistan with 1.5 years of trading experience.
I build and fix trading tools for MetaTrader 4 and MetaTrader 5:
• Expert Advisors (EAs) built from your strategy rules
• Custom indicators, alerts and on-chart panels
I build and fix trading tools for MetaTrader 4 and MetaTrader 5:
• Expert Advisors (EAs) built from your strategy rules
• Custom indicators, alerts and on-chart panels
- Views:
- 79
- Rating:
- Published:
-
 You are missing trading opportunities:
- Free trading apps
- Over 8,000 signals for copying
- Economic news for exploring financial markets
Registration Log inYou agree to website policy and terms of use
If you do not have an account, please register -
 Need a robot or indicator based on this code? Order it on Freelance
Go to Freelance
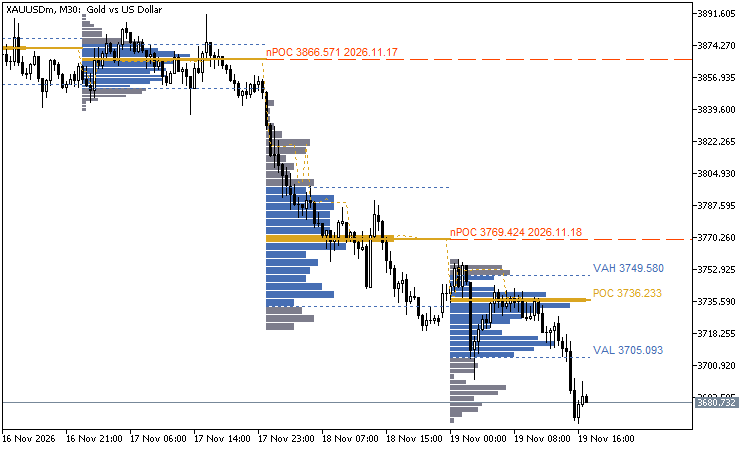
A volume profile shows at which prices the market traded the most during a day, a week or a month. The price with the most volume is the point of control (POC). The value area is the price range that holds 70 percent of the volume, between the value area high (VAH) and the value area low (VAL). A POC that price has not traded through again is called a naked POC. Many traders watch naked POCs as levels that price often comes back to.
Files
- VolumeProfileNakedPOC.mq5 - the indicator.
- BrokerTime.mqh - the time zone class (the same file as in the code "Broker Time"). Put both files in the same folder and compile the indicator.
What is drawn
- A histogram for each of the last profiles (5 by default): grey rows outside the value area, blue rows inside it, the POC row in gold.
- POC, VAH and VAL lines across each profile, and the current values with their prices at the right of the current profile.
- Naked POCs: a dashed line from the end of its profile to the right edge of the chart, with the price and the date. When price trades through it, the line is removed. The nearest 10 to the price are drawn.
- A dotted developing POC line: the POC as it was at the close of every bar. The developing VAH and VAL can be switched on too.
How it is calculated
- Volume from M1 bars: every chart bar is replaced by its M1 bars, so a profile on an H1 or H4 chart is as detailed as on an M1 chart. Where no M1 history exists (older than the history of your terminal), the chart bar itself is used. When the terminal has just started and the M1 history is still loading, the indicator waits and calculates again instead of using the chart bars without telling you.
- The volume of every bar is spread over the rows that its range touches, in proportion to the part of each row it covers.
- Rows: 30 rows per profile by default (from its lowest to its highest price).
- POC: the row with the most volume. When two rows have the same volume, the one nearer the middle of the profile wins, then the lower one.
- Value area: the classic method. Start at the POC, compare the next two rows above with the next two rows below and add the heavier pair, until 70 percent of the volume is inside. A one-row-at-a-time method can be chosen. Because rows are added in pairs, the value area holds a little more than 70 percent.
- Tick volume is used on forex and CFD symbols. On exchange symbols real volume can be chosen.
Day, week, month, year
- Auto: Day on M1 to H1, Week on H2 to H4, Month on H6 to D1, Year above.
- The day can start at the server midnight or at 17:00 New York, the start of the forex day. For 17:00 New York the class BrokerTime finds the clock of your broker from the Friday closes of the history, with the right summer time on every date. It can also be set by hand.
- With the server midnight, the short Sunday session of some brokers is added to Monday, so it does not make a small extra profile.
For Expert Advisors (8 buffers)
0 developing POC, 1 developing VAH, 2 developing VAL, 3 POC of the previous profile, 4 VAH of the previous profile, 5 VAL of the previous profile, 6 nearest naked POC above the close, 7 nearest naked POC below the close.
The values of a closed bar never change later: they are calculated only from the bars up to that bar. The open bar is calculated again at most twice a second.
When you call the indicator with iCustom, each "input group" counts as one parameter: pass a string for it, for example iCustom(_Symbol, _Period, "VolumeProfileNakedPOC", "Profile", 0, 0, ...).
Alerts
Optional: an alert and a push notification when price reaches a naked POC, once per level.
Inputs: profile period, day start, broker clock, volume source (M1 or chart bars), volume type, rows, value area percent and method, profiles to calculate, profiles to draw, histogram width, developing lines, naked POCs and how many, four colours, alerts.
Speed
Only the last 30 profiles are calculated (an input). Drawn objects are updated when a new bar starts and every 2 seconds. Nothing is drawn in a Strategy Tester run without visualization, but all buffers are calculated.
How it was tested
- An independent calculation in Python (own code, New York time from the IANA time zone database through zoneinfo) rebuilt all 8 buffers of every closed bar from the exported M1 and chart bars, for three setups on a live demo account: EURUSD H1 (day, server midnight, M1 bars, 30 rows, two-row value area), XAUUSD M15 (day from 17:00 New York, 50 rows, 68 percent, one-row method) and GBPUSD H4 (week, chart bars, 20 profiles). 33,207 comparisons, 0 differences.
- The check found two problems that were fixed before publishing: rows with exactly the same volume were decided by rounding noise, and a freshly started terminal used the chart bars while the M1 history was still loading.
- Validator-style runs in the Strategy Tester: EURUSD H1, XAUUSD D1, GBPUSD M30 and EURUSD M1 (663,241 bars): no errors.
- The screenshot is a real chart of a demo account.
Gold Session Liquidity Free MT5 - XAUUSD Sessions, Sweeps and Risk Planner
Free XAUUSD MT5 indicator with Asian session High/Low, closed-bar liquidity sweeps, swing structure breaks, EMA trend context and a manual lot-size risk planner. No automatic trading or guaranteed profit.
Daily Range Budget
Shows how much of the average daily range (ADR) has already been used today, and plots the two prices that today’s high and low could still reach if the day ends with an average range. Shows how much of the average daily range (ADR) has already been used today, and draws the two prices that today’s high and low can still reach if the day ends with an average range.
 EventTracer
An Expert Advisor for MetaTrader 5 that prints one line each time one of its event handlers runs, on a chart, in the Strategy Tester and during an optimization. It never trades.
Trailing Stop Manager - ATR, Chandelier, swing, SAR, MA, break-even with costs
Trails the stop loss of open positions with one of seven methods plus a break-even that includes the commission. Moves a stop only on a real improvement, never back, respects stop and freeze levels, limits requests. Restart-safe.