 MetaTrader 5
 Experts
 Indicators
 Scripts
 Libraries
 Storage
Watch how to download trading robots for free
Find us on Telegram!
Join our fan page
Join our fan page
You liked the script? Try it in the MetaTrader 5 terminal

Truncation Audit: Detecting Look-Ahead and Repainting in MQL5 Indicators. - indicator for MetaTrader 5

- Views:
- 34
- Published:
-
 You are missing trading opportunities:
- Free trading apps
- Over 8,000 signals for copying
- Economic news for exploring financial markets
Registration Log inYou agree to website policy and terms of use
If you do not have an account, please register -
 Need a robot or indicator based on this code? Order it on Freelance
Go to Freelance

Truncation Audit: Detecting Look-Ahead and Repainting in MQL5 Indicators
OVERVIEW
This is the third part of a series. PART1 (EQUIVALENCE CHECKER) tests whether an incremental, tick-by-tick calculation matches a calculation from scratch. PART 2(WARM UP METER) measures how much history a recursive indicator needs before its seed error disappears. This part asks a different question: does the value of a closed bar ever change when later bars arrive?
If it does, the indicator repaints or looks ahead. On a live chart that means a signal shown at the close of a bar may later move or vanish. In a backtest it is worse: the test reads the final values of the buffers, which contain information that did not exist when the bar closed, and the result is better than anything that could have been traded.
The audit rebuilds what the indicator could have known, bar by bar:
- Value at close (snapshot). For a bar that has just closed, the algorithm is evaluated with only the bars up to that bar, as if it were the newest bar on the chart. The result is stored once and never changes.
- Value now. On every new bar, each bar of the audit window is evaluated again with all bars up to the last closed bar.
- Comparison. The relative deviation between the two values is plotted on the same error-index scale as Parts 1 and 2. A bar whose deviation is above the tolerance changed after it closed.
- Future bars needed. For every changed bar the audit also measures how many later bars the value needed before it stopped changing: the bar is evaluated with the bars up to i , i+1 , i+2 , and so on, and the result is the position of the last evaluation that still differs from the final value. A centered average over 14 bars needs 7. A signal withdrawn by a higher bar two bars later need 2.
- Missing is a change. A value that does not exist at close but exists now (or the other way round) counts as a deviation of 1000, the top of the scale. If a value is missing at both moments, nothing changed.
Four test subjects are built in, selected with InpSubject . Two are controls that must pass, and two contain the typical mistakes, so you can see that the audit really fails when it should (the same idea as the fault injection in Part 1):
| Subject | What it does | Result on the fixed series (M15, 400 bars, tolerance 1e-9) |
|---|---|---|
| SMA(14) | Average of the last 14 bars. Control. | 0 of 400 bars changed. PASS. |
| EMA(14) | Recursion over InpWarmupBars bars up to the bar. Control. | 0 of 400 bars changed. PASS. |
| Centered MA(14) | Average of 7 bars on each side. Reads bars that do not exist at close. | 393 of 400 changed, each needing exactly 7 future bars. FAIL. The newest 7 bars have no value even now, so they count as unchanged. |
| Swing high(5) | Signal when a bar is higher than the 5 bars on each side. At close only the left side exists, so the signal is shown provisionally. | 73 of 400 changed, needing at most 5 future bars (1.6 on average). FAIL. The signals that were withdrawn are the changed bars. |
The numbers depend on the last closed bar, so they change a little from bar to bar.
To audit your own indicator, replace the body of Subject ( i, known) in the source. It must return the value of bar i when only the bars up to index known exist, and it must read every price through Px(k, known) . That accessor returns "no number" for any bar after known , so an indicator that reads a future bar (for example close[i+1] after a series-direction mistake) cannot silently pass: it gets no value at close and is reported. Return EMPTY_VALUE where your indicator draws nothing.
How the three parts fit together: Part 1 checks the state handling of the calculation, Part 2 sizes the history it needs, and Part 3 checks that closed-bar values do not depend on bars that come later. For the EMA subject, both evaluations start the recursion at the same bar ( InpWarmupBars bars before it), so the seed error measured in Part 2 is not mistaken for repainting. Use the warm-up recommended by the Warm-Up Meter.
WHAT TO LOOK OUT FOR
- Error index histogram (separate window). Each audited bar shows 17 + log10(relative deviation) between its value at close and its value now, limited to 0..20. The relative deviation is |at close - now| / max (1, |now|) . An unchanged bar has index 0 and draws nothing; a value that appears or disappears reaches 20.
- Bar color. White means the value changed after the bar closed (above tolerance); gray means a difference within tolerance.
- Dotted horizontal level marks the tolerance ( 17 + log10(InpTolerance) , which is 8 for the default 1e-9).
- Audit window. The newest InpAuditBars closed bars. The forming bar is never audited. The window moves one bar to the right when a new bar opens, so a bar can be flagged while it is inside the window and leave the display when it drops out.
- Data Window. Future bars needed (0 for unchanged bars), Value at close and Value now show the three numbers of the bar under the cursor (no lines are drawn).
- Status panel (six lines):
- Subject, data source and window length.
- Audited bars, bars that changed after close (count and percentage) and the tolerance.
- Worst relative deviation in the window.
- Future bars needed: the maximum and the mean over the changed bars (">N" if the value was still changing at the end of the InpMaxLag scan).
- Time of the newest changed bar and how many bars before the last closed bar it is.
- Verdict: PASS if no bar changed after close, otherwise FAIL.
- Experts journal. A one-line summary (audited, changed, maximum future bars needed, verdict) is printed when the indicator is removed from a live chart.
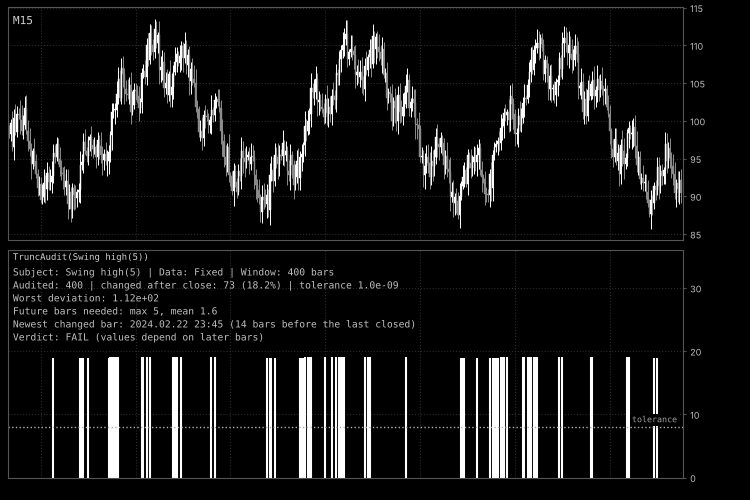
Fig. 1. Swing high (5 bars on each side) on the fixed M15 series, 400 audited bars. Each white bar is a bar whose value at close was changed by later bars: 73 of 400, needing at most 5 future bars. Unchanged bars have error index 0 and draw nothing. Black and white screenshot, per the Code Base image guidelines.
External variables (inputs)
| Input | Default | Purpose |
|---|---|---|
| InpSubject | Swing high (provisional signal, repaints) | Algorithm under test: SMA and EMA (controls that must pass), centered moving average (reads future bars), swing high (provisional signal that repaints). |
| InpPeriod | 14 | Averaging period of the SMA, EMA and centered moving average. Values are limited to 2..200. |
| InpSwingBars | 5 | Bars on each side of a swing high. Values are limited to 1..50. |
| InpWarmupBars | 200 | History used to start the EMA before each bar. Use the value recommended by the Warm-Up Meter (Part 2). Limited to 10..2000. |
| InpDataset | Fixed synthetic series | Data source: the fixed series (a function of bar open time, identical to Parts 1 and 2) or the chart close prices. |
| InpAuditBars | 400 | Number of newest closed bars audited. Limited to 20..2000. |
| InpMaxLag | 50 | Future bars checked when measuring how long a changed value keeps changing. Limited to 5..200. |
| InpTolerance | 1.0e-9 | Relative tolerance. Larger differences count as a change. Limited to 1e-15..1e-3. |
| InpShowPanel | true | Show or hide the status panel. |
| InpTextColor | clrSilver | Color of the panel text. |
Recommended use
- Place in the series. Run Part 1 and Part 2 first, then this audit before you trust a backtest of a new indicator. Select SMA or EMA to see a clean PASS, then your own algorithm.
- Controls first. The SMA and EMA subjects confirm that the audit itself does not invent changes. A correct causal calculation produces identical arithmetic in both evaluations, so unchanged bars differ by exactly zero, and the tolerance can stay very small.
- Window size. The vertical scale is fixed at 0..36 and the bars use 0..20, so the top of the window is free for the text panel. Make the indicator window about 250 pixels high (drag its upper border) so the six lines stay above the bars; in a smaller window the text overlaps the histogram.
- Choosing the window. A signal that repaints only rarely can be missing from a short window. Increase InpAuditBars and look at the percentage of changed bars. Choose InpMaxLag larger than the number of future bars you expect; otherwise the panel shows ">N".
- Fixed or chart data. The fixed series is the same on every symbol and broker, but it depends on the timeframe because it is a function of the bar open time. Use the chart data to audit the algorithm on the prices you really trade.
- Cost. The audit runs once on each new bar: each audited bar is evaluated once, plus up to InpMaxLag + 1 further evaluations for every bar that changed, so a new bar cost at most InpAuditBars x ( InpMaxLag + 2) evaluations (20,800 with the defaults, 404,000 with the largest settings). Each evaluation costs about one period of arithmetic (the warm-up length for the EMA). Ticks of the forming bar only refresh the source series and return at once, because closed bars cannot change. After a timeframe change or a history reload the snapshots of the window are rebuilt in the same way.
- Short history. The window is shorter than InpAuditBars until the chart holds enough bars. The panel shows "Not enough history" until the chart has at least the longest of InpWarmupBars , InpPeriod and InpSwingBars plus 14 bars (214 with the defaults).
- What a PASS means. It means that, within the audited window, the values of closed bars do not depend on later bars. It does not prove that the formula is correct, and it only covers the calculation as a function of the price data. State that survives between calls (for example an indicator buffer used as memory) is the subject of Part 1. Repainting caused by the broker revising its past bars is also outside the scope of this test.
- Strategy Tester. Run it in visual mode. The tester does not call OnDeinit() for indicators, so the summary line is printed only on a live chart.
- Chart theme. The change bars are white, so use a dark chart template or change the plot colors in the Colors tab.
- Account types. The indicator does not trade and does not depend on netting or hedging accounts.
Volatility Regime Percentile
Ranks the current ATR against its own recent history and colours each bar as a LOW, NORMAL or HIGH volatility regime, with a panel showing ATR in price and points, ATR vs its median and how long the regime has held.
 Trade Settings — Persist and Migrate Per-Trade Settings
Standalone MQL5 library for storing custom settings separately for each trade and following a verified pending-order-to-position lifecycle. It supports double, ulong and price-unit fields, terminal-local Global Variables, safe cleanup gates and an offline self-test. Includes a demo EA, source archive, and installation guide. A different-ticket transition, reconnection as a separate scenario, and netting behavior remain untested.
Accelerator Oscillator (AC)
The Acceleration/Deceleration Indicator (AC) measures acceleration and deceleration of the current driving force.
MACD Signals
Indicator edition for new platform.