 MetaTrader 5
 Experts
 Indicators
 Scripts
 Libraries
 Storage
Watch how to download trading robots for free
Find us on Facebook!
Join our fan page
Join our fan page
You liked the script? Try it in the MetaTrader 5 terminal

Hull Moving Average with Slope Color Change - indicator for MetaTrader 5

- Views:
- 53
- Published:
-
 You are missing trading opportunities:
- Free trading apps
- Over 8,000 signals for copying
- Economic news for exploring financial markets
Registration Log inYou agree to website policy and terms of use
If you do not have an account, please register -
 Need a robot or indicator based on this code? Order it on Freelance
Go to Freelance

Hull Moving Average with Slope Color Change
The idea behind it
Ordinary moving averages are smooth but late. Alan Hull designed his moving average to reduce that lag without giving up the smoothness. It is built from weighted moving averages (WMA) in three steps:
- Calculate a WMA of the price over n/2 bars (fast) and a WMA over n bars (slow).
- Take twice the fast one minus the slow one. This overshoots in the direction of the move and removes most of the lag.
- Smooth the result with a WMA over sqrt(n) bars to remove the noise that step 2 adds.
HMA = WMA(2 × WMA(price, n/2) − WMA(price, n), sqrt(n))
Because the Hull line turns early, the most useful information it gives is its direction. This indicator makes the direction visible at a glance: the line is drawn in one color while its slope is positive and in another while it is negative, so there is no need to compare values by eye. Optional arrows mark the bar where the slope changes from not-up to up, or from not-down to down.
The calculation is incremental: the applied price and the intermediate series are stored in buffers, and after the first pass only the last bar and new bars are recalculated on each tick.
How to interpret it
- Thick colored line (HMA): the Hull Moving Average. The color of each segment shows the slope on that bar: the "up" color when the HMA rose by more than the minimum slope, the "down" color when it fell by more than the minimum slope, and the neutral color when the change was smaller than the minimum.
- Up arrow below the bar: the HMA slope has just turned up.
- Down arrow above the bar: the HMA slope has just turned down.
- Text label in the lower left corner of the chart: the slope state of the last closed bar (UP, DOWN or FLAT) and the change of the HMA per bar in points.
- A long run of one color is a steady trend; frequent color changes mean a range or an HMA period that is too short for the timeframe.
- The first bars of the history are left empty: the HMA needs n + round(sqrt(n)) − 2 bars to start, and one more bar to get a direction.
- Arrows are drawn on closed bars by default, so they do not appear and disappear while a bar is forming. The line color of the live bar can still change until the bar closes.
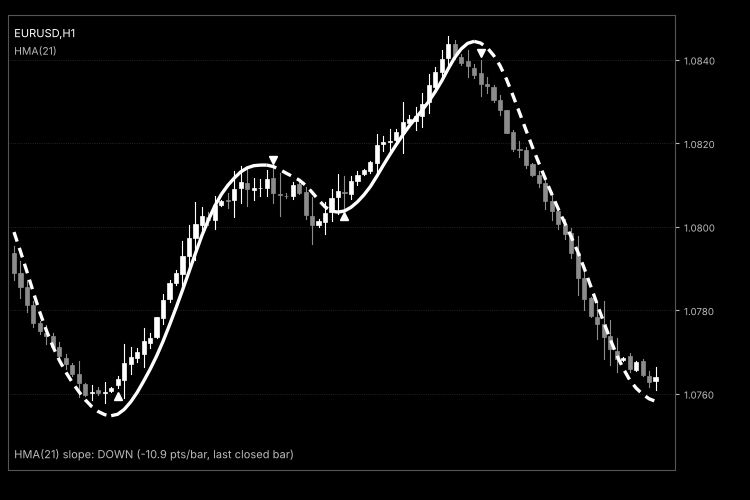
Fig. 1. HMA(21) on an EURUSD H1 chart with the turn arrows and the slope label. The image is black & white according to the Code Base image guidelines: a rising HMA is shown as a solid line and a falling HMA as a dashed line; on a real chart these are the configurable up and down colors.
External variables (inputs)
| Input | Default | Purpose |
|---|---|---|
| Hull moving average | ||
| InpPeriod | 21 | HMA period n. The fast WMA uses n/2 bars (integer division) and the final smoothing uses round(sqrt(n)) bars. Must be at least 2. |
| InpPrice | PRICE_CLOSE | Applied price: close, open, high, low, median, typical or weighted. |
| Slope | ||
| InpMinSlopePoints | 0.0 | Minimum change of the HMA per bar, in points, for the slope to count as up or down. Smaller changes are treated as flat. With 0.0 any change colors the line. Must not be negative. |
| Colors and signals | ||
| InpColorUp | clrDodgerBlue | Line and arrow color for an upward slope. |
| InpColorDown | clrRed | Line and arrow color for a downward slope. |
| InpColorFlat | clrGray | Line color when the slope is below the minimum. |
| InpShowArrows | true | Shows arrows where the slope turns up or down. |
| InpClosedBarsOnly | true | Draws arrows only on closed bars, so that an arrow never appears and disappears on the live bar. |
| InpShowLabel | true | Shows the text label with the slope state of the last closed bar. |
| InpLabelColor | clrGray | Color of the text label. |
Recommended use
- Symbols and timeframes. It works on any symbol and timeframe, since it only uses prices. Shorter periods (9 to 21) suit M5 to H1; longer ones (34 to 55) suit H4 and D1.
- Trend filter. The slope color works well as a direction filter: for example, look for long entries only while the line has the up color, and for short entries only while it has the down color.
- Flat market. In a range the HMA changes direction often. Set InpMinSlopePoints to a value that is typical for the noise of your symbol, so that small wiggles are shown with the neutral color instead of as reversals. The unit is points, so the useful value depends on the symbol and its number of digits.
- Repainting. Like every moving average, the value of the live bar changes until it closes. With InpClosedBarsOnly enabled, arrows are never drawn on the live bar, so closed-bar signals do not repaint. Since the HMA is built from weighted averages of the whole window, the values of earlier bars do not change once they are closed.
- Lag. The HMA is faster than an SMA or EMA of the same period, but it is still based on past prices, and it can overshoot near sharp reversals. The arrow appears when the slope has already turned; it is not a prediction.
- Chart objects. The indicator creates one text label (when InpShowLabel is enabled) and deletes it when the indicator is removed or reloaded.
- Account types. It is a visual indicator: it does not trade, does not need DLLs and works the same on netting and hedging accounts.
- The indicator is an analysis aid and is not a trading signal by itself. Combine it with your own entry rules and risk management.
 Gold Trend Breakout Lite — educational XAUUSD trend-following EA
Open-source gold EA built on XAUUSD's multi-day trend persistence: H1 Donchian breakout in the direction of the D1 EMA slope, 3×ATR hard stop, break-even at +1R. Fixed lot, one position, no grid, no martingale.
Risk Lot Panel — drag the stop line, read the lot size for your risk percentage
On-chart position-size calculator. Drag the stop line (and optional target line) and the panel shows lots for your risk %, money at risk and reward:risk. Uses OrderCalcProfit, so it is correct for gold, indices, crypto, FX and any account currency.
Kaufman Adaptive Moving Average (KAMA) Ribbon
A ribbon of Kaufman Adaptive Moving Averages with growing Efficiency Ratio periods, drawn in a monochrome gradient, with an on-chart label showing whether the ribbon is bullish, bearish or mixed.
ATR Trailing Stop Line (Chandelier Exit)
ATR Trailing Stop Line (Chandelier Exit): a volatility-based trailing stop that hangs below the highest high in an up-trend and rises above the lowest low in a down-trend, with trend-flip arrows, an on-chart status label and optional alerts.