 MetaTrader 5
 Experts
 Indicators
 Scripts
 Libraries
 Storage
Watch how to download trading robots for free
Find us on Telegram!
Join our fan page
Join our fan page
You liked the script? Try it in the MetaTrader 5 terminal

Tick Volume Delta Histogram (Buy/Sell Pressure Estimate) - indicator for MetaTrader 5

- Views:
- 45
- Rating:
- Published:
-
 You are missing trading opportunities:
- Free trading apps
- Over 8,000 signals for copying
- Economic news for exploring financial markets
Registration Log inYou agree to website policy and terms of use
If you do not have an account, please register -
 Need a robot or indicator based on this code? Order it on Freelance
Go to Freelance

Tick Volume Delta Histogram (Buy/Sell Pressure Estimate)
The idea behind it
In the forex and CFD markets there is no centralized exchange tape, so the real number of contracts bought and sold in each bar is not available. MetaTrader provides tick volume – the number of price changes in a bar – which is a widely used proxy for activity. What it does not say is who was the aggressor.
This indicator makes a simple, transparent estimate. For each bar a ratio r between −1 (all sellers) and +1 (all buyers) is derived from the shape of the candle. The tick volume V is then split as:
- buy part = V · (1 + r) / 2
- sell part = V · (1 − r) / 2
- delta = buy part − sell part = V · r
Three methods for r are available: the close location value (where the close sits inside the bar's range), the body-to-range ratio, and the bar-level tick rule (+1 if the close is above the previous close, −1 if below). The result is an estimate of pressure, not a record of real orders.
How to interpret it
- Histogram above zero – estimated buying pressure dominated the bar; below zero – selling pressure dominated. The height is the delta in ticks (absolute mode) or in percent of the bar's tick volume (percent mode, scale −100..100).
- Four colors – strong buy, buy, sell and strong sell. A bar is "strong" when |delta| is at least InpStrongPercent percent of its tick volume, i.e. when the candle closed decisively near one extreme.
- Dashed line – the exponential moving average (period InpSmoothPeriod) of the plotted delta. It shows the prevailing pressure and helps to separate a single spike from a sustained shift.
- Dotted zero level – the balance line between buyers and sellers.
- Info label (upper-left of the subwindow) – delta, estimated buy % and sell %, and the tick count of the current bar.
- Divergences – price making a new high while the delta and its EMA fail to confirm it can warn that the move is losing support; the reverse applies to lows.
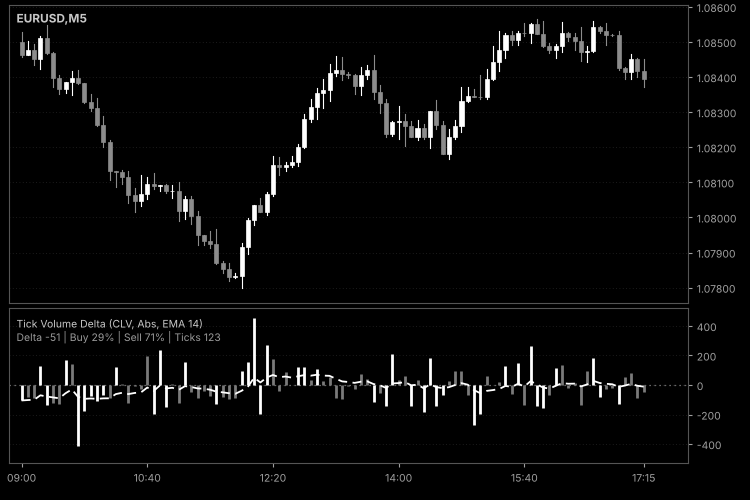
Fig. 1. Tick Volume Delta Histogram with the EMA line below an M5 chart: strong bars in white, normal bars in gray; black & white image per Code Base image guidelines (colors are configurable in the indicator properties).
External variables (inputs)
| Input | Default | Purpose |
|---|---|---|
| InpMethod | TVD_METHOD_CLV | Method used to split the bar volume: close location value, body to range, or close versus previous close (+1/−1). |
| InpMode | TVD_MODE_ABSOLUTE | Histogram units: absolute delta in ticks, or percent of the tick volume (fixed scale −100..100). |
| InpStrongPercent | 60.0 | A bar is drawn in a "strong" color when |delta| is at least this percentage of its tick volume (0–100). |
| InpSmoothPeriod | 14 | Period of the EMA line drawn over the delta; 0 hides the line. |
| InpShowInfoLabel | true | Shows the label with the delta, buy % and sell % of the current bar. |
| InpLabelColor | clrSilver | Color of the info label. |
Recommended use
- Symbols and timeframes: works on any symbol and timeframe. The estimate is most informative on liquid instruments and on M1–H1; on very low timeframes the candle shape is noisy, on high timeframes a single bar mixes many different phases.
- Choosing a method: the close location value reacts to the position of the close in the range and also reflects long wicks; the body ratio ignores the wicks' direction and rewards strong directional candles; the close-to-close rule is the coarsest, because the whole volume is assigned to one side.
- Caveats: the indicator uses tick volume of the broker's feed and a bar-level approximation. It does not read individual ticks or the order book, so it cannot reproduce true aggressor volume. Tick volume can differ between brokers. The current bar changes with every tick, so the last histogram bar and the label can change sign before the bar closes.
- Calculation: all values depend only on the bar itself (and on the previous bar for the EMA), so after the first full calculation only the forming bar and new bars are processed.
- Account types: the indicator does not trade and works identically on netting and hedging accounts.
- The info label is created with a unique prefix in the indicator subwindow and removed when the indicator is deleted or reinitialized. Use the delta as additional context together with your own entry rules and risk management.
Session VWAP with Standard Deviation Bands
Session-anchored VWAP with volume-weighted standard deviation bands. It restarts at every daily, weekly or monthly session open and shows how far price has stretched from the average price paid during the session.
Anchored VWAP with Draggable Anchor Point
Anchored VWAP with a draggable anchor line: drag the vertical line to any bar and the volume-weighted average price and its deviation bands are rebuilt from that bar onward.
Accelerator Oscillator (AC)
The Acceleration/Deceleration Indicator (AC) measures acceleration and deceleration of the current driving force.
MACD Signals
Indicator edition for new platform.